30
/fr/
AIzaSyAYiBZKx7MnpbEhh9jyipgxe19OcubqV5w
April 1, 2024
69901
Argentina
ARG
true
2
1
High-technology exports (current US$)
2016,2015,2014,2013,2012,2011,2010,2009,2008,2007,2006,2005,2004,2003,2002,2001,2000,1999,1998,1997,1996,1995,1994,1993
Download
Bibliothèque de statistiques globales →Argentina →

High-technology exports (current US$)

Cette statistique dans les autres pays:

AlbaniaAlgeriaAndorraAntigua and BarbudaArab WorldArgentinaArmeniaArubaAustraliaAustriaAzerbaijanBahamas, TheBahrainBangladeshBarbadosBelarusBelgiumBelizeBeninBermudaBhutanBoliviaBosnia and HerzegovinaBotswanaBrazilBrunei DarussalamBulgariaBurkina FasoBurundiCabo VerdeCambodiaCameroonCanadaCaribbean small statesCentral African RepublicCentral Europe and the BalticsChileChinaColombiaComorosCongo, Rep.Costa RicaCote d'IvoireCroatiaCubaCyprusCzech RepublicDenmarkDjiboutiDominicaDominican RepublicEarly-demographic dividendEast Asia & PacificEcuadorEgypt, Arab Rep.El SalvadorEritreaEstoniaEthiopiaEuro areaEurope & Central AsiaEurope & Central Asia (excluding high income)Europe & Central Asia (IDA & IBRD countries)European UnionFaroe IslandsFijiFinlandFranceFrench PolynesiaGabonGambia, TheGeorgiaGermanyGhanaGreeceGreenlandGrenadaGuatemalaGuineaGuinea-BissauGuyanaHaitiHeavily indebted poor countries (HIPC)High incomeHondurasHong Kong SAR, ChinaHungaryIBRD onlyIcelandIDA & IBRD totalIDA blendIDA onlyIDA totalIndiaIndonesiaIran, Islamic Rep.IraqIrelandIsraelItalyJamaicaJapanJordanKazakhstanKenyaKiribatiKorea, Rep.KuwaitKyrgyz RepublicLate-demographic dividendLatin America & Caribbean Latin America & Caribbean (excluding high income)Latin America & the Caribbean (IDA & IBRD countries)LatviaLebanonLesothoLithuaniaLow & middle incomeLow incomeLower middle incomeLuxembourgMacao SAR, ChinaMacedonia, FYRMadagascarMalawiMalaysiaMaldivesMaliMaltaMauritiusMexicoMiddle East & North AfricaMiddle East & North Africa (excluding high income)Middle East & North Africa (IDA & IBRD countries)Middle incomeMoldovaMongoliaMontenegroMoroccoMozambiqueMyanmarNamibiaNepalNetherlandsNew CaledoniaNew ZealandNicaraguaNigerNigeriaNorth AmericaNorwayOECD membersOmanOther small statesPakistanPalauPanamaPapua New GuineaParaguayPeruPhilippinesPolandPortugalPost-demographic dividendQatarRomaniaRussian FederationRwandaSamoaSao Tome and PrincipeSaudi ArabiaSenegalSerbiaSeychellesSierra LeoneSingaporeSlovak RepublicSloveniaSmall statesSolomon IslandsSouth AfricaSouth AsiaSouth Asia (IDA & IBRD)South SudanSpainSri LankaSt. Kitts and NevisSt. LuciaSt. Vincent and the GrenadinesSub-Saharan Africa Sub-Saharan Africa (excluding high income)Sub-Saharan Africa (IDA & IBRD countries)SudanSurinameSwazilandSwedenSwitzerlandSyrian Arab RepublicTajikistanTanzaniaThailandTimor-LesteTogoTongaTrinidad and TobagoTunisiaTurkeyTurkmenistanTurks and Caicos IslandsTuvaluUgandaUkraineUnited Arab EmiratesUnited KingdomUnited StatesUpper middle incomeUruguayVanuatuVenezuela, RBVietnamWest Bank and GazaWorldYemen, Rep.ZambiaZimbabwe

La ligne de temps

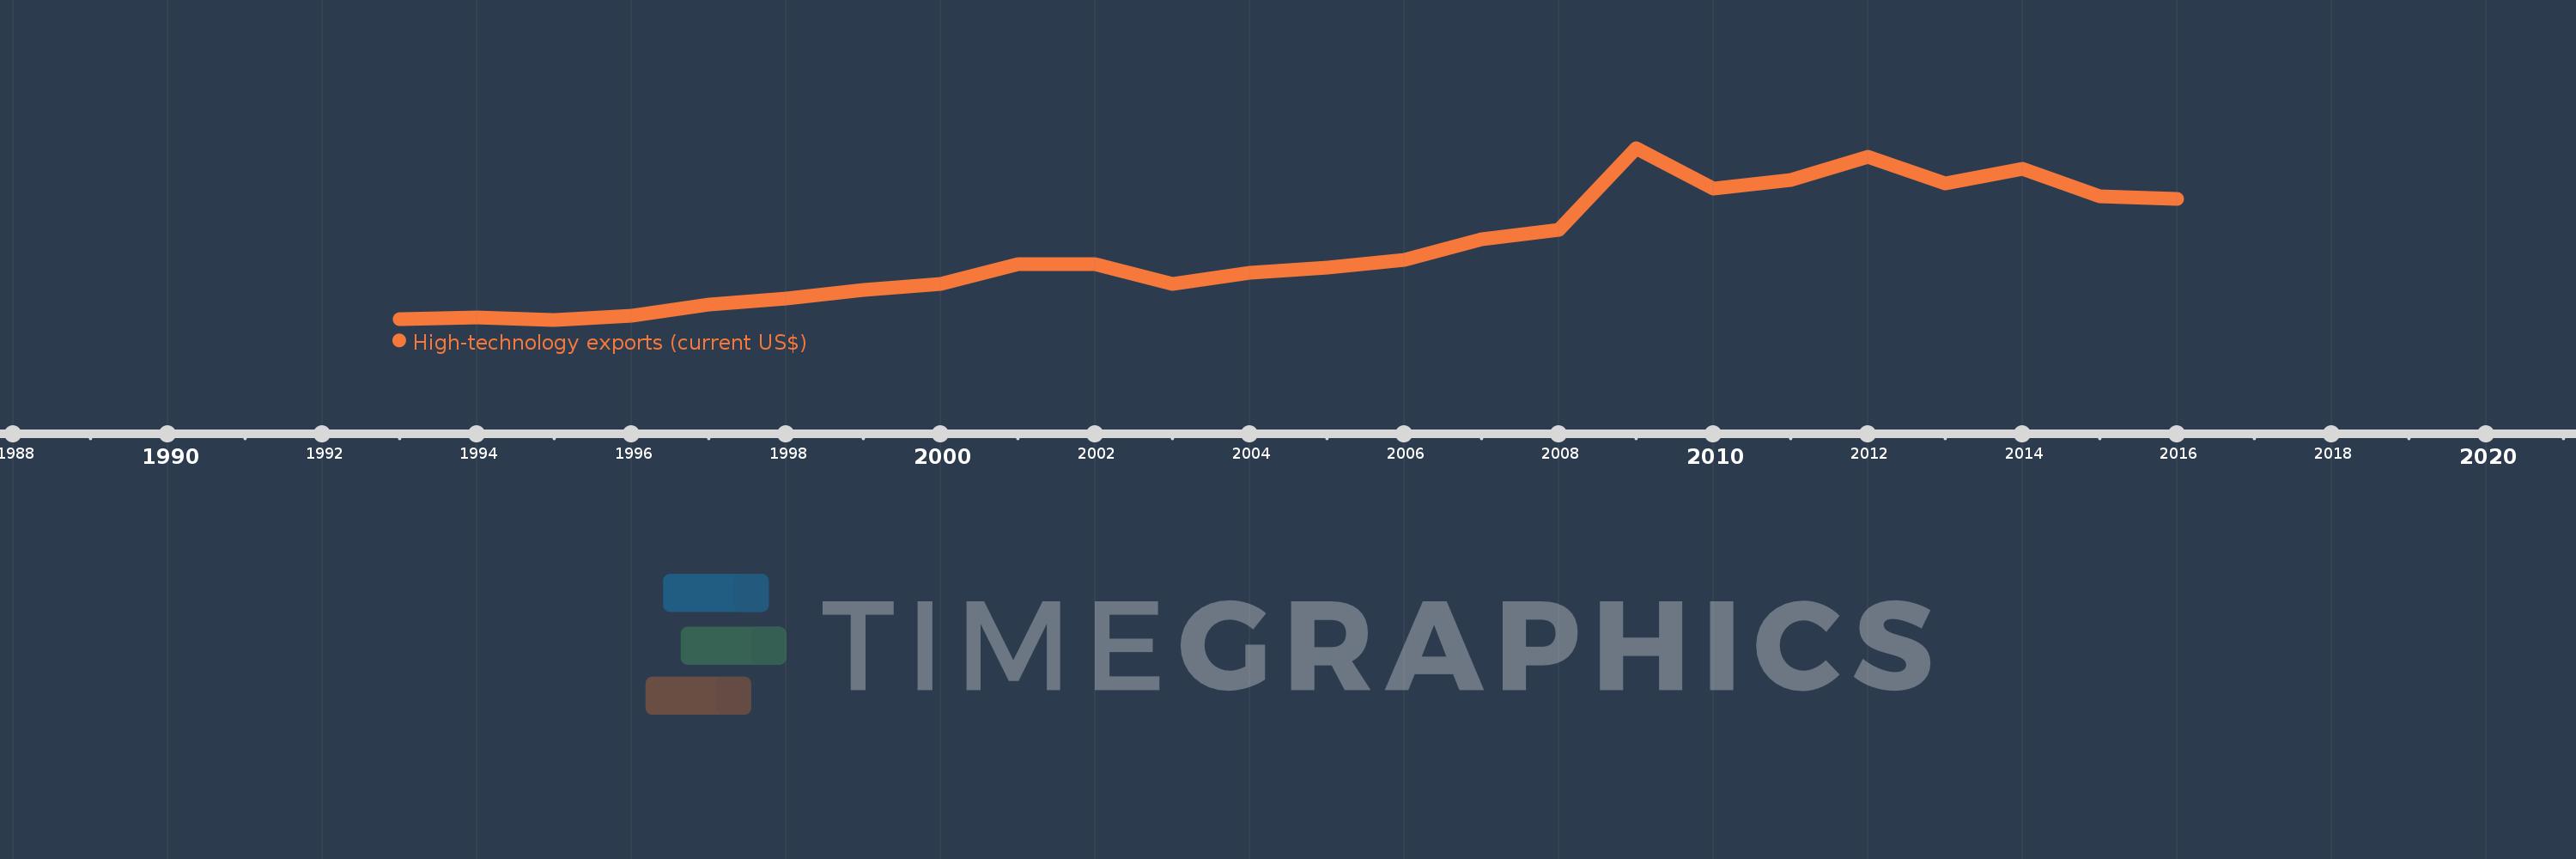
Cette échelle de temps montre un graphique de 1993 année à 2016 année Argentina. Les données jusqu'à 1992 année ne sont pas présentés. Quantité d'observations actuelles selon dates: 24.

Source (désignation):

Les indicateurs du développement mondiale

Source (organisation):

United Nations, Comtrade database.

Catégories:

Private Sector, Science & Technology, Trade

Dernière mise à jour

23 avr. 2017

Les indicateurs de changement de valeurs selon les années

En moyenne:
958.529 mln.
Minimum:
247.037 mln.
1 janv. 1995
Maximum:
1.949 mds
1 janv. 2009
Pour la date d''observation
Valeur
Changement absolu
Le changement par rapport à la valeur précédente
1 janv. 1993
255.887 mln.
+255.887 mln.
0.0%
1 janv. 1994
271.336 mln.
+15.449 mln.
6.04%
1 janv. 1995
247.037 mln.
-24.299 mln.
-8.96%
1 janv. 1996
285.395 mln.
+38.357 mln.
15.53%
1 janv. 1997
400.463 mln.
+115.069 mln.
40.32%
1 janv. 1998
460.223 mln.
+59.759 mln.
14.92%
1 janv. 1999
544.457 mln.
+84.235 mln.
18.3%
1 janv. 2000
599.028 mln.
+54.571 mln.
10.02%
1 janv. 2001
797.074 mln.
+198.046 mln.
33.06%
1 janv. 2002
800.15 mln.
+3.076 mln.
0.39%
1 janv. 2003
600.022 mln.
-200.128 mln.
-25.01%
1 janv. 2004
710.282 mln.
+110.259 mln.
18.38%
1 janv. 2005
761.458 mln.
+51.176 mln.
7.21%
1 janv. 2006
840.304 mln.
+78.846 mln.
10.35%
1 janv. 2007
1.044 mds
+203.613 mln.
24.23%
1 janv. 2008
1.14 mds
+95.964 mln.
9.19%
1 janv. 2009
1.949 mds
+808.636 mln.
70.94%
1 janv. 2010
1.547 mds
-401.697 mln.
-20.62%
1 janv. 2011
1.628 mds
+81.293 mln.
5.26%
1 janv. 2012
1.862 mds
+234.337 mln.
14.39%
1 janv. 2013
1.601 mds
-261.399 mln.
-14.04%
1 janv. 2014
1.745 mds
+144.109 mln.
9.0%
1 janv. 2015
1.473 mds
-271.946 mln.
-15.58%
1 janv. 2016
1.442 mds
-30.763 mln.
-2.09%

Classement des pays selon les statistiques actuelles par années