30
/fr/
AIzaSyAYiBZKx7MnpbEhh9jyipgxe19OcubqV5w
April 1, 2024
123584
Ecuador
ECU
true
2
1
High-technology exports (current US$)
2016,2015,2014,2013,2012,2011,2010,2009,2008,2007,2006,2005,2004,2003,2002,2001,2000,1999,1998,1997,1996,1995,1994,1993,1992,1991
Download
Bibliothèque de statistiques globales →Ecuador →

High-technology exports (current US$)

Cette statistique dans les autres pays:

AlbaniaAlgeriaAndorraAntigua and BarbudaArab WorldArgentinaArmeniaArubaAustraliaAustriaAzerbaijanBahamas, TheBahrainBangladeshBarbadosBelarusBelgiumBelizeBeninBermudaBhutanBoliviaBosnia and HerzegovinaBotswanaBrazilBrunei DarussalamBulgariaBurkina FasoBurundiCabo VerdeCambodiaCameroonCanadaCaribbean small statesCentral African RepublicCentral Europe and the BalticsChileChinaColombiaComorosCongo, Rep.Costa RicaCote d'IvoireCroatiaCubaCyprusCzech RepublicDenmarkDjiboutiDominicaDominican RepublicEarly-demographic dividendEast Asia & PacificEcuadorEgypt, Arab Rep.El SalvadorEritreaEstoniaEthiopiaEuro areaEurope & Central AsiaEurope & Central Asia (excluding high income)Europe & Central Asia (IDA & IBRD countries)European UnionFaroe IslandsFijiFinlandFranceFrench PolynesiaGabonGambia, TheGeorgiaGermanyGhanaGreeceGreenlandGrenadaGuatemalaGuineaGuinea-BissauGuyanaHaitiHeavily indebted poor countries (HIPC)High incomeHondurasHong Kong SAR, ChinaHungaryIBRD onlyIcelandIDA & IBRD totalIDA blendIDA onlyIDA totalIndiaIndonesiaIran, Islamic Rep.IraqIrelandIsraelItalyJamaicaJapanJordanKazakhstanKenyaKiribatiKorea, Rep.KuwaitKyrgyz RepublicLate-demographic dividendLatin America & Caribbean Latin America & Caribbean (excluding high income)Latin America & the Caribbean (IDA & IBRD countries)LatviaLebanonLesothoLithuaniaLow & middle incomeLow incomeLower middle incomeLuxembourgMacao SAR, ChinaMacedonia, FYRMadagascarMalawiMalaysiaMaldivesMaliMaltaMauritiusMexicoMiddle East & North AfricaMiddle East & North Africa (excluding high income)Middle East & North Africa (IDA & IBRD countries)Middle incomeMoldovaMongoliaMontenegroMoroccoMozambiqueMyanmarNamibiaNepalNetherlandsNew CaledoniaNew ZealandNicaraguaNigerNigeriaNorth AmericaNorwayOECD membersOmanOther small statesPakistanPalauPanamaPapua New GuineaParaguayPeruPhilippinesPolandPortugalPost-demographic dividendQatarRomaniaRussian FederationRwandaSamoaSao Tome and PrincipeSaudi ArabiaSenegalSerbiaSeychellesSierra LeoneSingaporeSlovak RepublicSloveniaSmall statesSolomon IslandsSouth AfricaSouth AsiaSouth Asia (IDA & IBRD)South SudanSpainSri LankaSt. Kitts and NevisSt. LuciaSt. Vincent and the GrenadinesSub-Saharan Africa Sub-Saharan Africa (excluding high income)Sub-Saharan Africa (IDA & IBRD countries)SudanSurinameSwazilandSwedenSwitzerlandSyrian Arab RepublicTajikistanTanzaniaThailandTimor-LesteTogoTongaTrinidad and TobagoTunisiaTurkeyTurkmenistanTurks and Caicos IslandsTuvaluUgandaUkraineUnited Arab EmiratesUnited KingdomUnited StatesUpper middle incomeUruguayVanuatuVenezuela, RBVietnamWest Bank and GazaWorldYemen, Rep.ZambiaZimbabwe

La ligne de temps

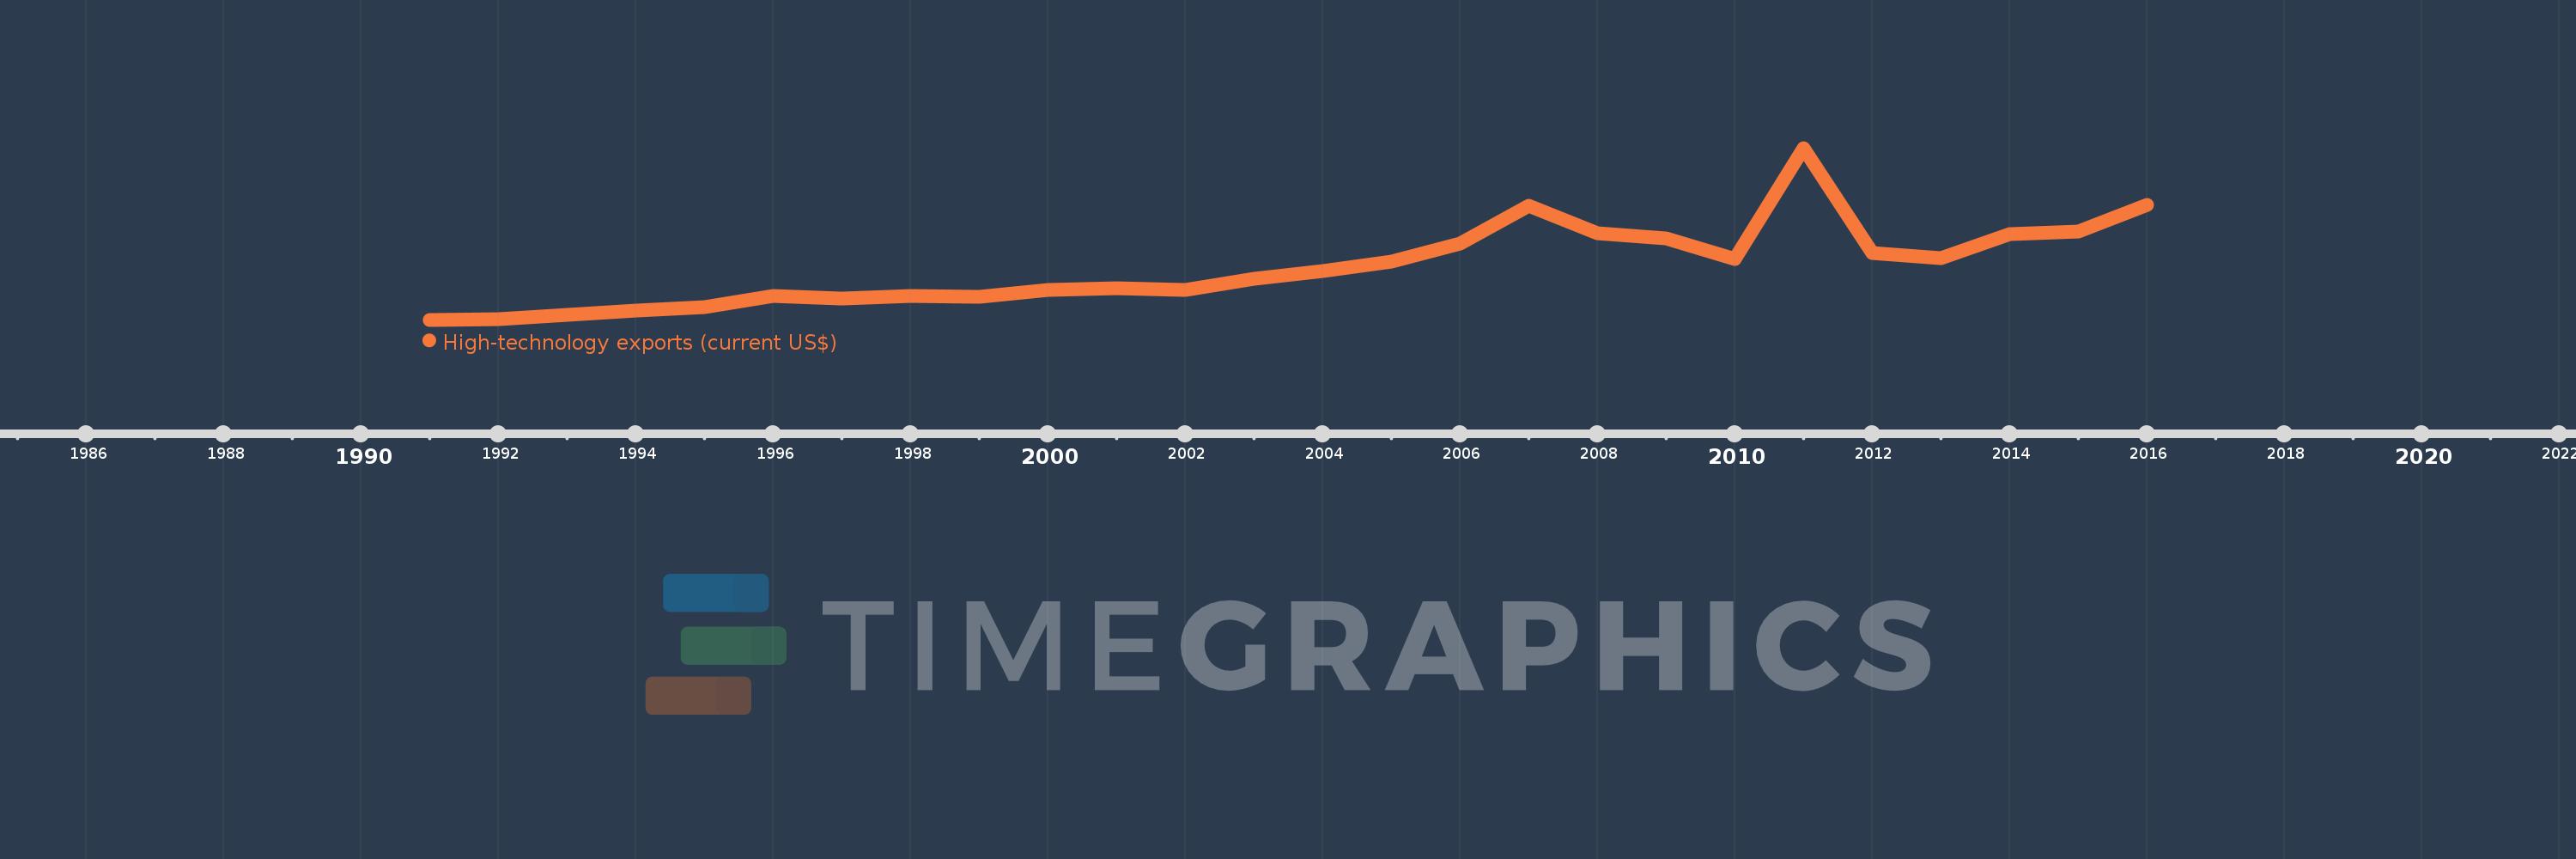
Cette échelle de temps montre un graphique de 1991 année à 2016 année Ecuador. Les données jusqu'à 1990 année ne sont pas présentés. Quantité d'observations actuelles selon dates: 26.

Source (désignation):

Les indicateurs du développement mondiale

Source (organisation):

United Nations, Comtrade database.

Catégories:

Private Sector, Science & Technology, Trade

Dernière mise à jour

23 avr. 2017

Les indicateurs de changement de valeurs selon les années

En moyenne:
44.316 mln.
Minimum:
201.282 milles
1 janv. 1991
Maximum:
144.508 mln.
1 janv. 2011
Pour la date d''observation
Valeur
Changement absolu
Le changement par rapport à la valeur précédente
1 janv. 1991
201.282 milles
+201.282 milles
0.0%
1 janv. 1992
659.521 milles
+458.239 milles
227.66%
1 janv. 1993
4.102 mln.
+3.443 mln.
522.0%
1 janv. 1994
7.629 mln.
+3.526 mln.
85.96%
1 janv. 1995
10.485 mln.
+2.857 mln.
37.45%
1 janv. 1996
19.949 mln.
+9.464 mln.
90.26%
1 janv. 1997
18.314 mln.
-1.635 mln.
-8.19%
1 janv. 1998
20.3 mln.
+1.986 mln.
10.84%
1 janv. 1999
19.707 mln.
-593.709 milles
-2.92%
1 janv. 2000
25.025 mln.
+5.319 mln.
26.99%
1 janv. 2001
26.766 mln.
+1.741 mln.
6.96%
1 janv. 2002
25.378 mln.
-1.388 mln.
-5.18%
1 janv. 2003
34.604 mln.
+9.226 mln.
36.35%
1 janv. 2004
41.111 mln.
+6.507 mln.
18.8%
1 janv. 2005
48.765 mln.
+7.654 mln.
18.62%
1 janv. 2006
64.252 mln.
+15.487 mln.
31.76%
1 janv. 2007
96.213 mln.
+31.961 mln.
49.74%
1 janv. 2008
72.955 mln.
-23.258 mln.
-24.17%
1 janv. 2009
68.175 mln.
-4.78 mln.
-6.55%
1 janv. 2010
51.245 mln.
-16.93 mln.
-24.83%
1 janv. 2011
144.508 mln.
+93.263 mln.
182.0%
1 janv. 2012
56.609 mln.
-87.899 mln.
-60.83%
1 janv. 2013
52.231 mln.
-4.379 mln.
-7.73%
1 janv. 2014
71.781 mln.
+19.55 mln.
37.43%
1 janv. 2015
74.241 mln.
+2.46 mln.
3.43%
1 janv. 2016
97.006 mln.
+22.766 mln.
30.66%

Classement des pays selon les statistiques actuelles par années