29
/fr/
fr
AIzaSyAYiBZKx7MnpbEhh9jyipgxe19OcubqV5w
April 1, 2024
67643
Angola
AGO
true
2
1
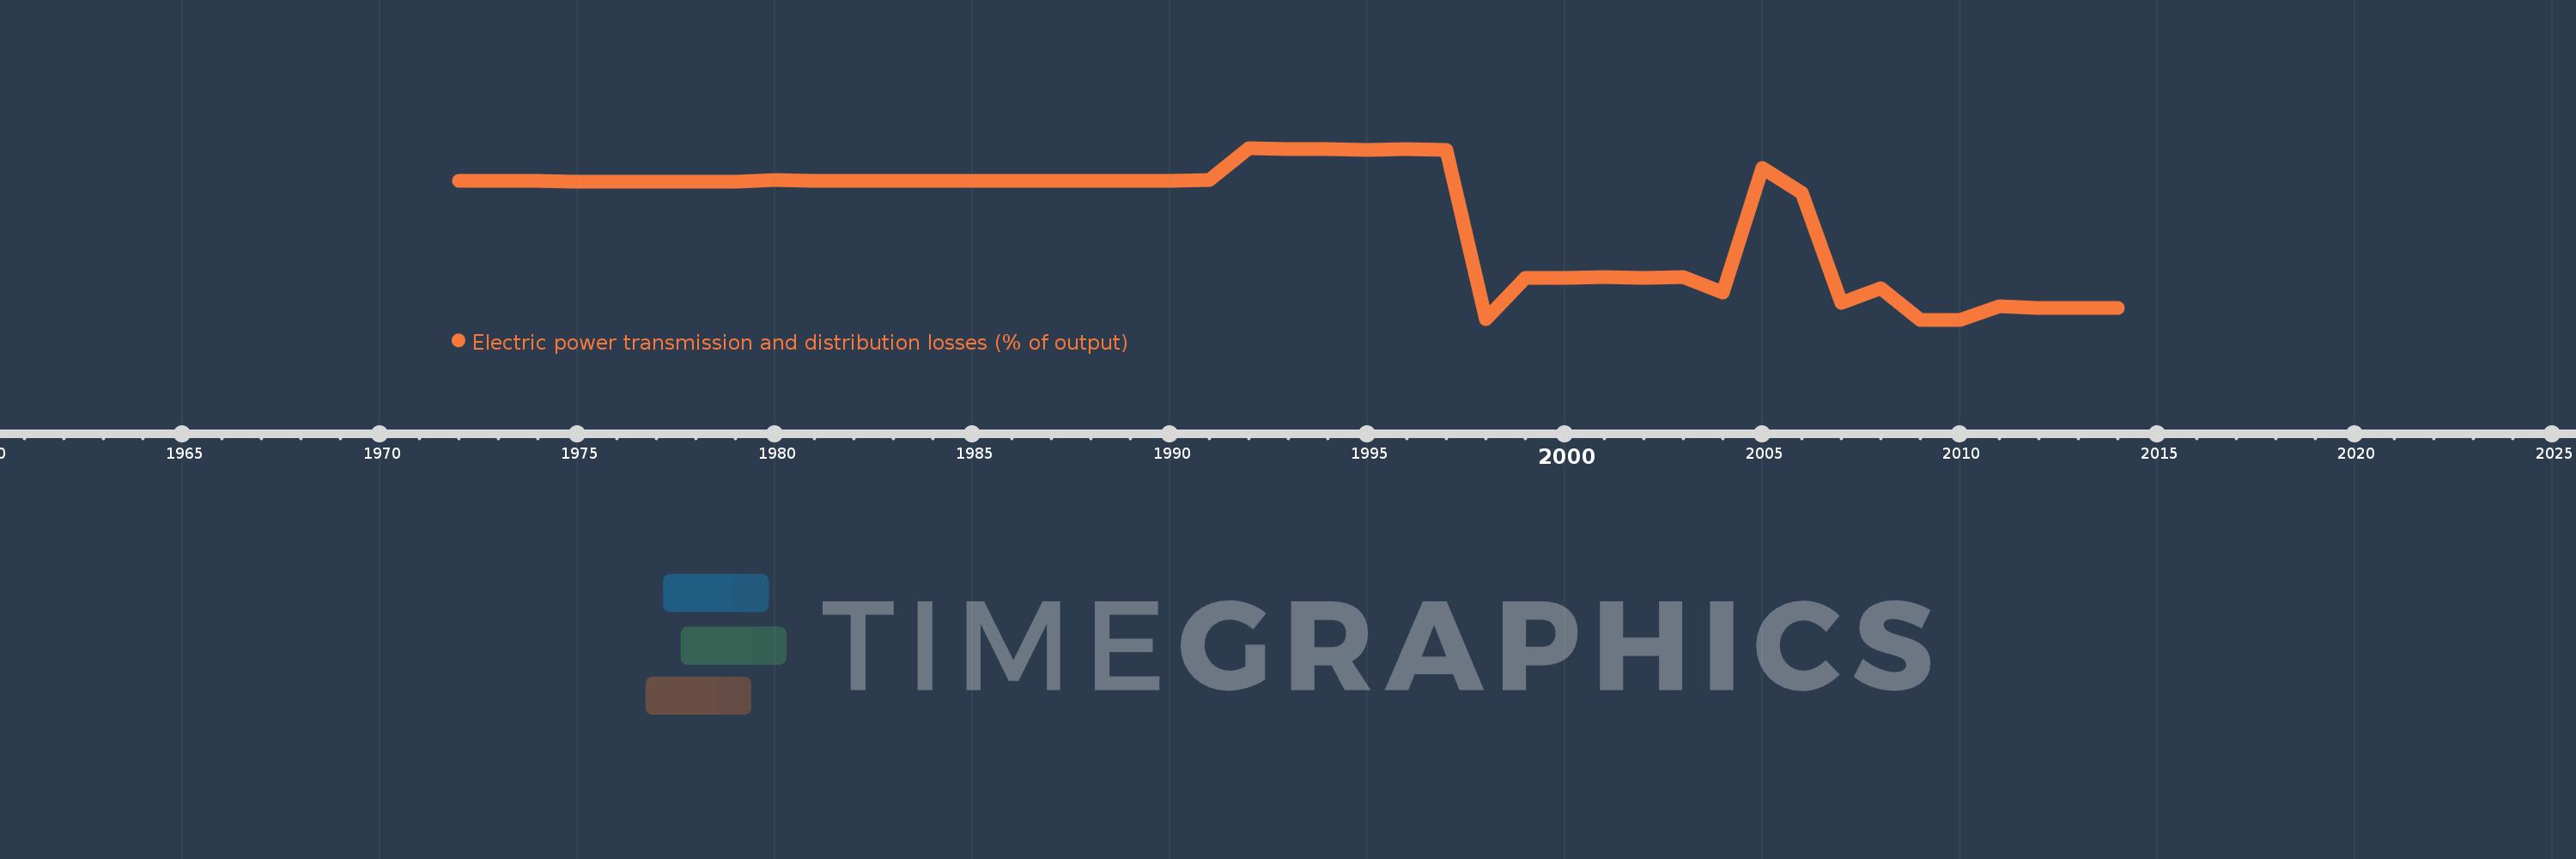
Electric power transmission and distribution losses (% of output)
2014,2013,2012,2011,2010,2009,2008,2007,2006,2005,2004,2003,2002,2001,2000,1999,1998,1997,1996,1995,1994,1993,1992,1991,1990,1989,1988,1987,1986,1985,1984,1983,1982,1981,1980,1979,1978,1977,1976,1975,1974,1973,1972
Cette statistique dans les autres pays:
AlbaniaAlgeriaAngolaArab WorldArgentinaArmeniaAustraliaAustriaAzerbaijanBahrainBangladeshBelarusBelgiumBeninBoliviaBosnia and HerzegovinaBotswanaBrazilBrunei DarussalamBulgariaCambodiaCameroonCanadaCaribbean small statesCentral Europe and the BalticsChileChinaColombiaCongo, Dem. Rep.Congo, Rep.Costa RicaCote d'IvoireCroatiaCubaCuracaoCyprusCzech RepublicDenmarkDominican RepublicEarly-demographic dividendEast Asia & PacificEast Asia & Pacific (excluding high income)East Asia & Pacific (IDA & IBRD countries)EcuadorEgypt, Arab Rep.El SalvadorEritreaEstoniaEthiopiaEuro areaEurope & Central AsiaEurope & Central Asia (excluding high income)Europe & Central Asia (IDA & IBRD countries)European UnionFinlandFragile and conflict affected situationsFranceGabonGeorgiaGermanyGhanaGibraltarGreeceGuatemalaHaitiHeavily indebted poor countries (HIPC)High incomeHondurasHong Kong SAR, ChinaHungaryIBRD onlyIcelandIDA & IBRD totalIDA blendIDA onlyIDA totalIndiaIndonesiaIran, Islamic Rep.IraqIrelandIsraelItalyJamaicaJapanJordanKazakhstanKenyaKorea, Dem. People’s Rep.Korea, Rep.KosovoKuwaitKyrgyz RepublicLate-demographic dividendLatin America & Caribbean Latin America & Caribbean (excluding high income)Latin America & the Caribbean (IDA & IBRD countries)LatviaLeast developed countries: UN classificationLebanonLibyaLithuaniaLow & middle incomeLow incomeLower middle incomeLuxembourgMacedonia, FYRMalaysiaMaltaMauritiusMexicoMiddle East & North AfricaMiddle East & North Africa (excluding high income)Middle East & North Africa (IDA & IBRD countries)Middle incomeMoldovaMongoliaMontenegroMoroccoMozambiqueMyanmarNamibiaNepalNetherlandsNew ZealandNicaraguaNigerNigeriaNorth AmericaNorwayOECD membersOmanOther small statesPakistanPanamaParaguayPeruPhilippinesPolandPortugalPost-demographic dividendPre-demographic dividendQatarRomaniaRussian FederationSaudi ArabiaSenegalSerbiaSingaporeSlovak RepublicSloveniaSmall statesSouth AfricaSouth AsiaSouth Asia (IDA & IBRD)South SudanSpainSri LankaSub-Saharan Africa Sub-Saharan Africa (excluding high income)Sub-Saharan Africa (IDA & IBRD countries)SudanSwedenSwitzerlandSyrian Arab RepublicTajikistanTanzaniaThailandTogoTrinidad and TobagoTunisiaTurkeyTurkmenistanUkraineUnited Arab EmiratesUnited KingdomUnited StatesUpper middle incomeUruguayUzbekistanVenezuela, RBVietnamWorldYemen, Rep.ZambiaZimbabwe La ligne de temps
Cette échelle de temps montre un graphique de 1972 année à 2014 année Angola. Les données jusqu'à 1971 année ne sont pas présentés. Quantité d'observations actuelles selon dates: 43.
Source (désignation):
Les indicateurs du développement mondiale
Source (organisation):
IEA Statistics © OECD/IEA 2014 (http://www.iea.org/stats/index.asp), subject to https://www.iea.org/t&c/termsandconditions/
Catégories:
Energy & Mining, Infrastructure
Dernière mise à jour
23 avr. 2017
Les indicateurs de changement de valeurs selon les années
Minimum:
10.01
1 janv. 2009
Maximum:
28.587
1 janv. 1992
Pour la date d''observation
Valeur
Changement absolu
Le changement par rapport à la valeur précédente
1 janv. 1972
25.067
+25.067
0.0%
1 janv. 1973
25.06
-0.008
-0.03%
1 janv. 1974
25.0
-0.06
-0.24%
1 janv. 1975
24.98
-0.02
-0.08%
1 janv. 1976
24.981
+0.001
0.0%
1 janv. 1977
24.957
-0.024
-0.09%
1 janv. 1978
24.957
0.0
0.0%
1 janv. 1979
24.957
0.0
0.0%
1 janv. 1980
25.079
+0.122
0.49%
1 janv. 1981
25.037
-0.042
-0.17%
1 janv. 1982
25.037
0.0
0.0%
1 janv. 1983
25.0
-0.037
-0.15%
1 janv. 1984
25.032
+0.032
0.13%
1 janv. 1985
25.075
+0.043
0.17%
1 janv. 1986
25.062
-0.013
-0.05%
1 janv. 1987
25.062
0.0
0.0%
1 janv. 1988
25.062
0.0
0.0%
1 janv. 1989
25.031
-0.031
-0.12%
1 janv. 1990
25.031
0.0
0.0%
1 janv. 1991
25.089
+0.059
0.23%
1 janv. 1992
28.587
+3.498
13.94%
1 janv. 1993
28.511
-0.076
-0.26%
1 janv. 1994
28.421
-0.09
-0.32%
1 janv. 1995
28.377
-0.044
-0.16%
1 janv. 1996
28.438
+0.061
0.21%
1 janv. 1997
28.405
-0.033
-0.12%
1 janv. 1998
10.035
-18.37
-64.67%
1 janv. 1999
14.568
+4.533
45.17%
1 janv. 2000
14.532
-0.036
-0.25%
1 janv. 2001
14.602
+0.07
0.48%
1 janv. 2002
14.53
-0.072
-0.49%
1 janv. 2003
14.618
+0.088
0.6%
1 janv. 2004
12.932
-1.685
-11.53%
1 janv. 2005
26.434
+13.501
104.4%
1 janv. 2006
23.762
-2.672
-10.11%
1 janv. 2007
11.797
-11.965
-50.35%
1 janv. 2008
13.398
+1.601
13.57%
1 janv. 2009
10.01
-3.388
-25.29%
1 janv. 2010
10.011
+0.001
0.01%
1 janv. 2011
11.507
+1.496
14.95%
1 janv. 2012
11.272
-0.234
-2.04%
1 janv. 2013
11.277
+0.005
0.04%
1 janv. 2014
11.276
-0.001
-0.01%
Classement des pays selon les statistiques actuelles par années


Commentaires: