29
/fr/
fr
AIzaSyAYiBZKx7MnpbEhh9jyipgxe19OcubqV5w
April 1, 2024
262116
Thailand
THA
true
2
1
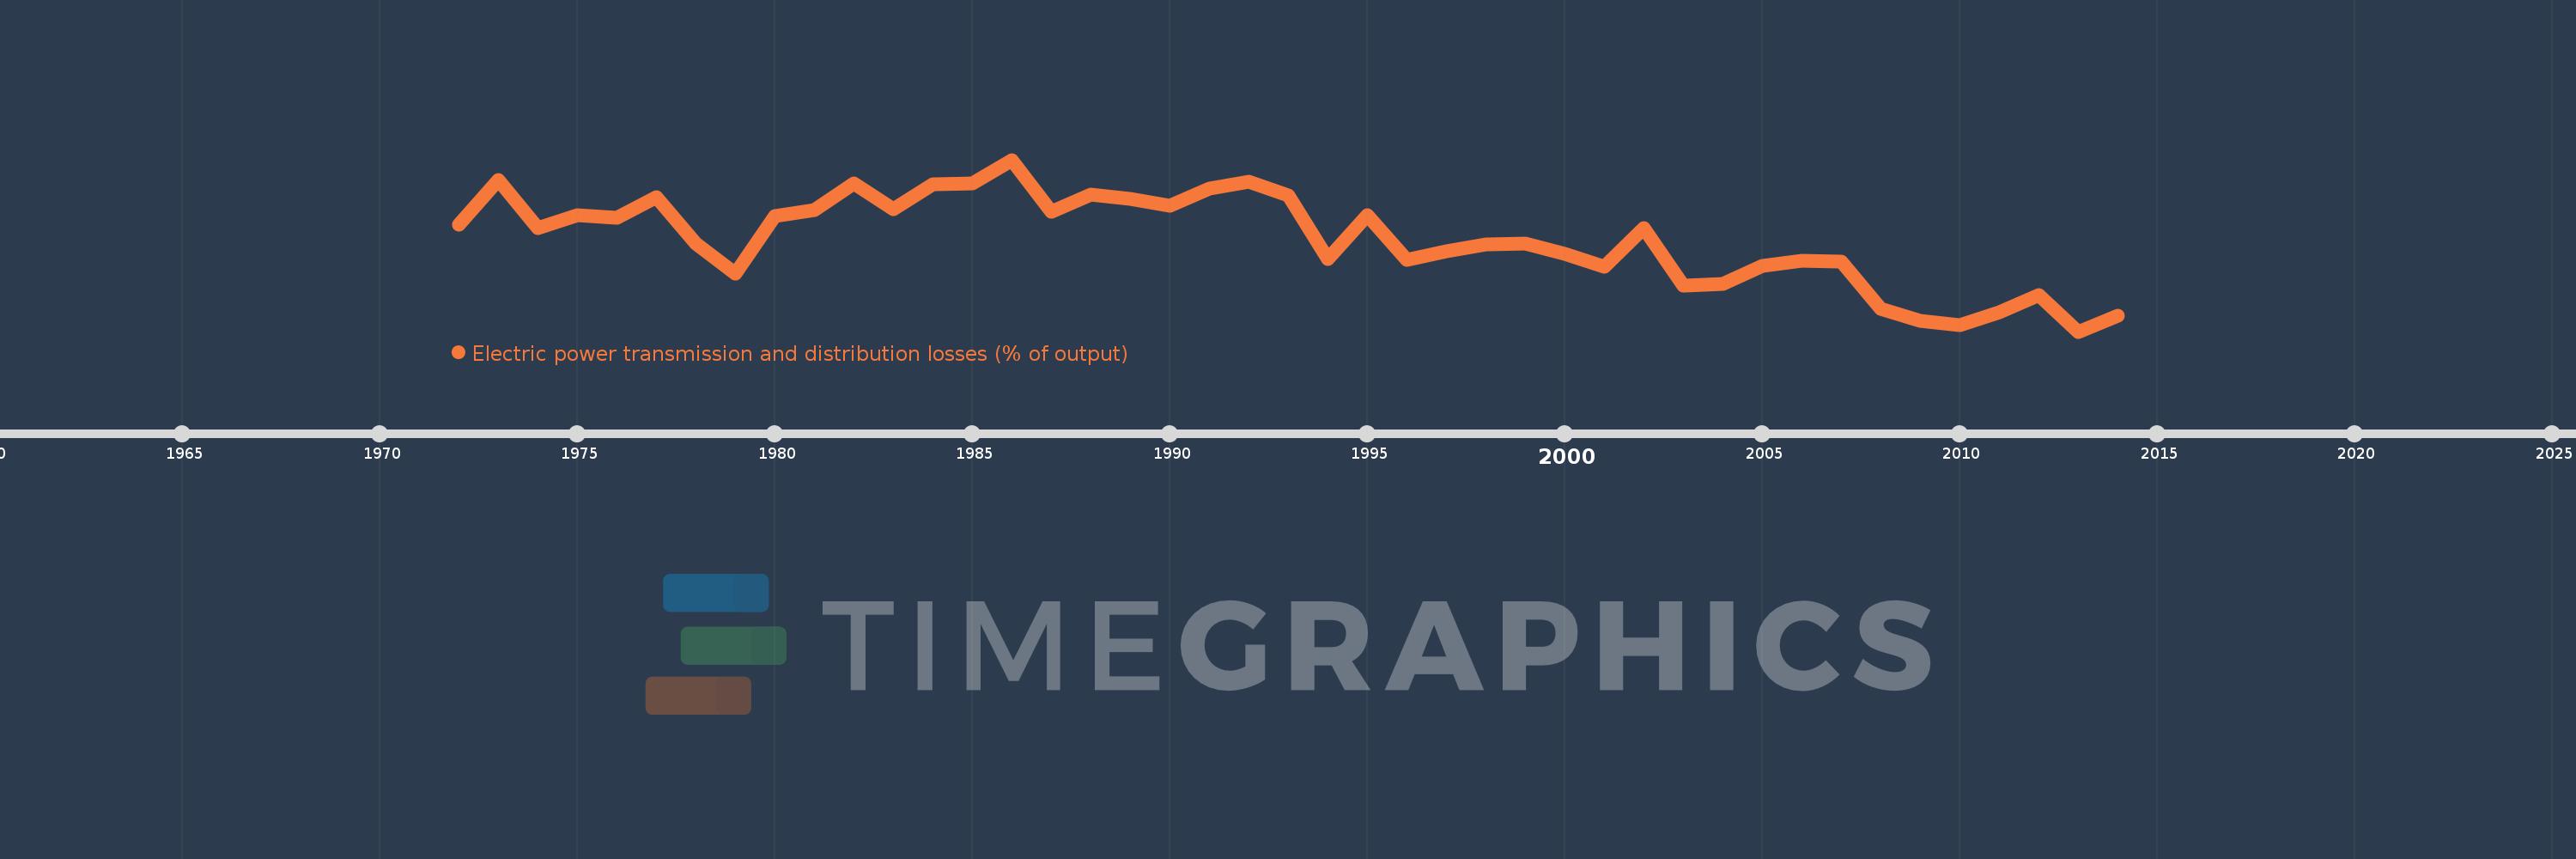
Electric power transmission and distribution losses (% of output)
2014,2013,2012,2011,2010,2009,2008,2007,2006,2005,2004,2003,2002,2001,2000,1999,1998,1997,1996,1995,1994,1993,1992,1991,1990,1989,1988,1987,1986,1985,1984,1983,1982,1981,1980,1979,1978,1977,1976,1975,1974,1973,1972
Cette statistique dans les autres pays:
AlbaniaAlgeriaAngolaArab WorldArgentinaArmeniaAustraliaAustriaAzerbaijanBahrainBangladeshBelarusBelgiumBeninBoliviaBosnia and HerzegovinaBotswanaBrazilBrunei DarussalamBulgariaCambodiaCameroonCanadaCaribbean small statesCentral Europe and the BalticsChileChinaColombiaCongo, Dem. Rep.Congo, Rep.Costa RicaCote d'IvoireCroatiaCubaCuracaoCyprusCzech RepublicDenmarkDominican RepublicEarly-demographic dividendEast Asia & PacificEast Asia & Pacific (excluding high income)East Asia & Pacific (IDA & IBRD countries)EcuadorEgypt, Arab Rep.El SalvadorEritreaEstoniaEthiopiaEuro areaEurope & Central AsiaEurope & Central Asia (excluding high income)Europe & Central Asia (IDA & IBRD countries)European UnionFinlandFragile and conflict affected situationsFranceGabonGeorgiaGermanyGhanaGibraltarGreeceGuatemalaHaitiHeavily indebted poor countries (HIPC)High incomeHondurasHong Kong SAR, ChinaHungaryIBRD onlyIcelandIDA & IBRD totalIDA blendIDA onlyIDA totalIndiaIndonesiaIran, Islamic Rep.IraqIrelandIsraelItalyJamaicaJapanJordanKazakhstanKenyaKorea, Dem. People’s Rep.Korea, Rep.KosovoKuwaitKyrgyz RepublicLate-demographic dividendLatin America & Caribbean Latin America & Caribbean (excluding high income)Latin America & the Caribbean (IDA & IBRD countries)LatviaLeast developed countries: UN classificationLebanonLibyaLithuaniaLow & middle incomeLow incomeLower middle incomeLuxembourgMacedonia, FYRMalaysiaMaltaMauritiusMexicoMiddle East & North AfricaMiddle East & North Africa (excluding high income)Middle East & North Africa (IDA & IBRD countries)Middle incomeMoldovaMongoliaMontenegroMoroccoMozambiqueMyanmarNamibiaNepalNetherlandsNew ZealandNicaraguaNigerNigeriaNorth AmericaNorwayOECD membersOmanOther small statesPakistanPanamaParaguayPeruPhilippinesPolandPortugalPost-demographic dividendPre-demographic dividendQatarRomaniaRussian FederationSaudi ArabiaSenegalSerbiaSingaporeSlovak RepublicSloveniaSmall statesSouth AfricaSouth AsiaSouth Asia (IDA & IBRD)South SudanSpainSri LankaSub-Saharan Africa Sub-Saharan Africa (excluding high income)Sub-Saharan Africa (IDA & IBRD countries)SudanSwedenSwitzerlandSyrian Arab RepublicTajikistanTanzaniaThailandTogoTrinidad and TobagoTunisiaTurkeyTurkmenistanUkraineUnited Arab EmiratesUnited KingdomUnited StatesUpper middle incomeUruguayUzbekistanVenezuela, RBVietnamWorldYemen, Rep.ZambiaZimbabwe La ligne de temps
Cette échelle de temps montre un graphique de 1972 année à 2014 année Thailand. Les données jusqu'à 1971 année ne sont pas présentés. Quantité d'observations actuelles selon dates: 43.
Source (désignation):
Les indicateurs du développement mondiale
Source (organisation):
IEA Statistics © OECD/IEA 2014 (http://www.iea.org/stats/index.asp), subject to https://www.iea.org/t&c/termsandconditions/
Catégories:
Energy & Mining, Infrastructure
Dernière mise à jour
23 avr. 2017
Les indicateurs de changement de valeurs selon les années
Minimum:
5.695
1 janv. 2013
Maximum:
11.528
1 janv. 1986
Pour la date d''observation
Valeur
Changement absolu
Le changement par rapport à la valeur précédente
1 janv. 1972
9.325
+9.325
0.0%
1 janv. 1973
10.845
+1.52
16.3%
1 janv. 1974
9.21
-1.636
-15.08%
1 janv. 1975
9.655
+0.446
4.84%
1 janv. 1976
9.573
-0.082
-0.85%
1 janv. 1977
10.248
+0.675
7.05%
1 janv. 1978
8.698
-1.55
-15.13%
1 janv. 1979
7.652
-1.046
-12.02%
1 janv. 1980
9.611
+1.959
25.6%
1 janv. 1981
9.829
+0.219
2.27%
1 janv. 1982
10.716
+0.887
9.02%
1 janv. 1983
9.86
-0.857
-7.99%
1 janv. 1984
10.707
+0.848
8.6%
1 janv. 1985
10.731
+0.023
0.22%
1 janv. 1986
11.528
+0.798
7.43%
1 janv. 1987
9.754
-1.774
-15.39%
1 janv. 1988
10.348
+0.594
6.09%
1 janv. 1989
10.208
-0.14
-1.35%
1 janv. 1990
9.969
-0.239
-2.34%
1 janv. 1991
10.562
+0.593
5.95%
1 janv. 1992
10.774
+0.212
2.01%
1 janv. 1993
10.317
-0.457
-4.24%
1 janv. 1994
8.151
-2.167
-21.0%
1 janv. 1995
9.648
+1.497
18.37%
1 janv. 1996
8.123
-1.525
-15.81%
1 janv. 1997
8.431
+0.309
3.8%
1 janv. 1998
8.653
+0.222
2.63%
1 janv. 1999
8.687
+0.034
0.39%
1 janv. 2000
8.321
-0.366
-4.22%
1 janv. 2001
7.908
-0.413
-4.96%
1 janv. 2002
9.2
+1.292
16.34%
1 janv. 2003
7.262
-1.939
-21.07%
1 janv. 2004
7.31
+0.049
0.67%
1 janv. 2005
7.939
+0.628
8.59%
1 janv. 2006
8.105
+0.167
2.1%
1 janv. 2007
8.058
-0.047
-0.58%
1 janv. 2008
6.464
-1.594
-19.78%
1 janv. 2009
6.074
-0.39
-6.04%
1 janv. 2010
5.914
-0.16
-2.63%
1 janv. 2011
6.345
+0.431
7.28%
1 janv. 2012
6.945
+0.6
9.46%
1 janv. 2013
5.695
-1.25
-17.99%
1 janv. 2014
6.24
+0.545
9.57%
Classement des pays selon les statistiques actuelles par années


Commentaires: