29
/fr/
fr
AIzaSyAYiBZKx7MnpbEhh9jyipgxe19OcubqV5w
April 1, 2024
67642
Angola
AGO
true
2
1
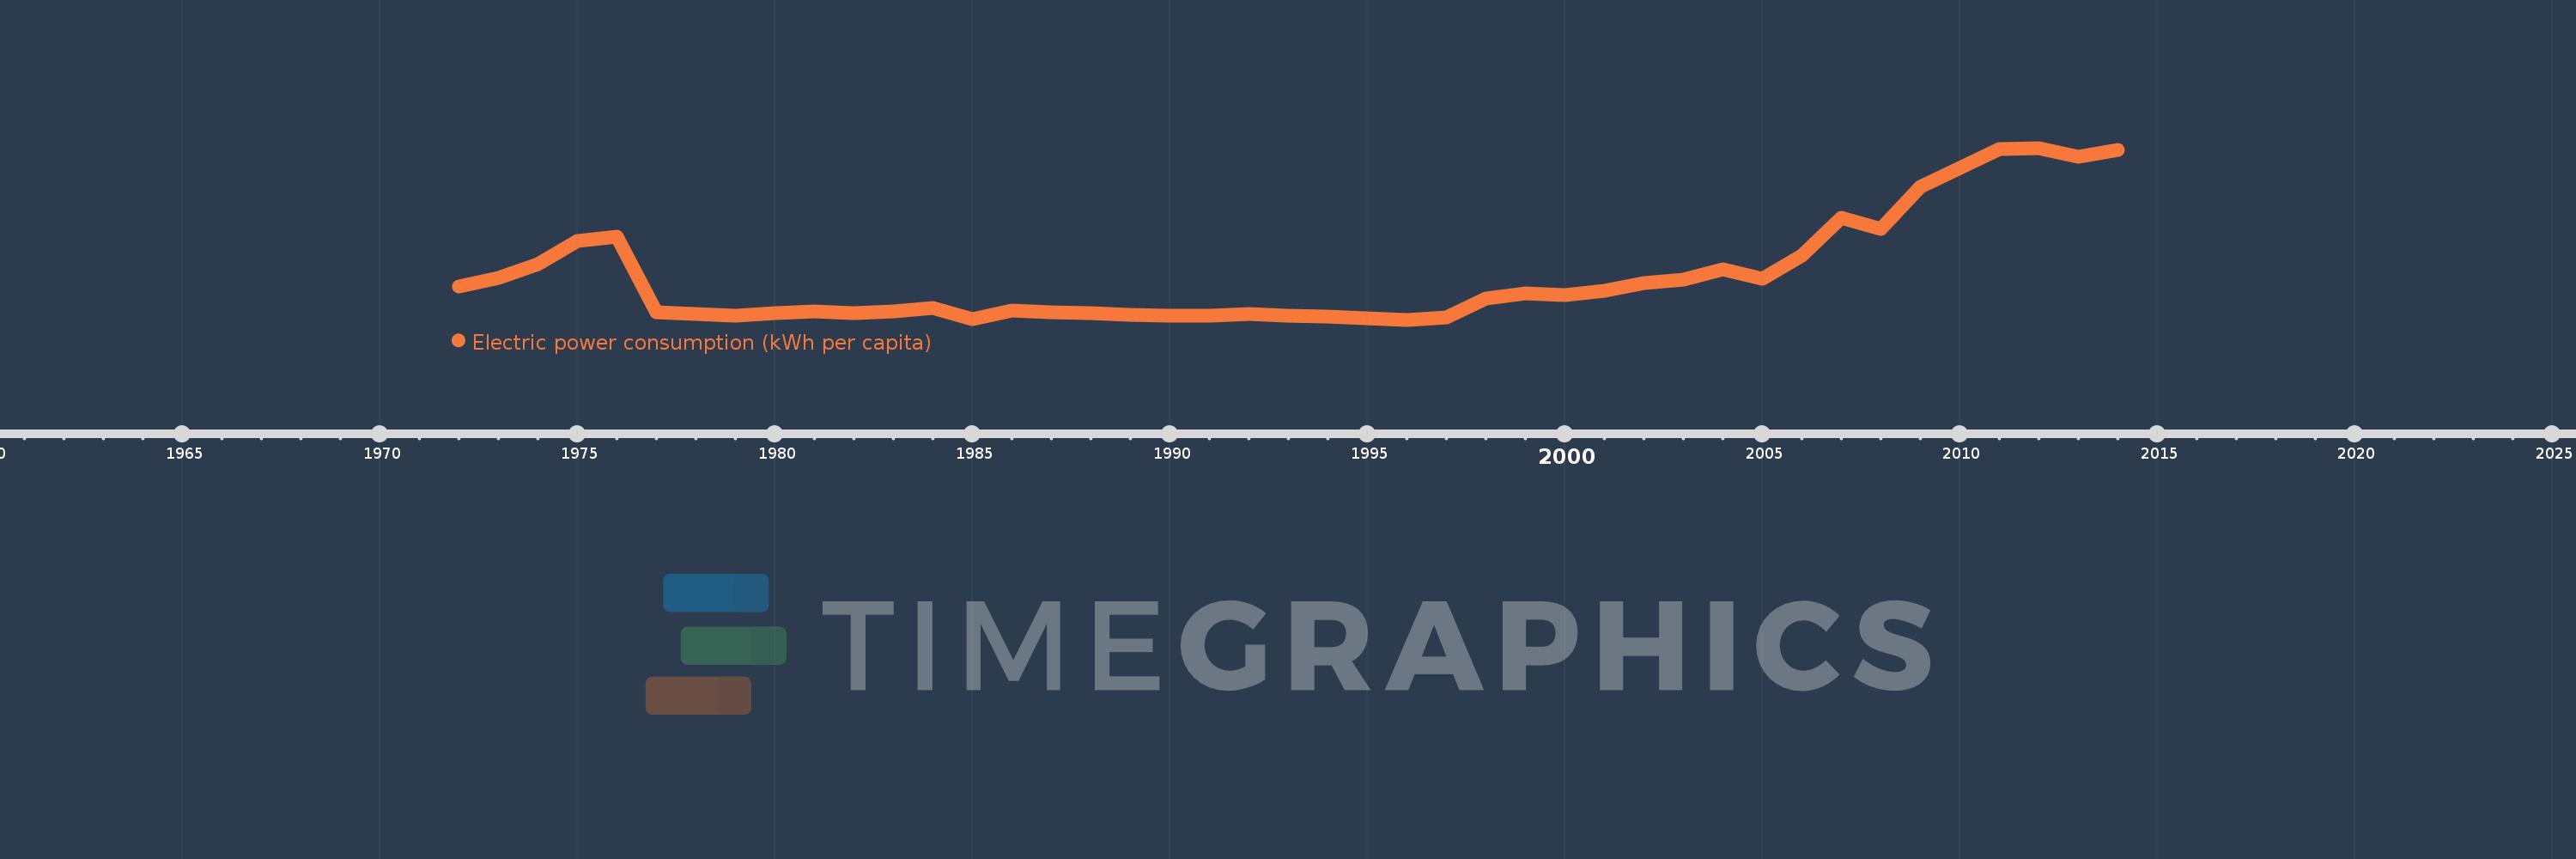
Electric power consumption (kWh per capita)
2014,2013,2012,2011,2010,2009,2008,2007,2006,2005,2004,2003,2002,2001,2000,1999,1998,1997,1996,1995,1994,1993,1992,1991,1990,1989,1988,1987,1986,1985,1984,1983,1982,1981,1980,1979,1978,1977,1976,1975,1974,1973,1972
Cette statistique dans les autres pays:
AlbaniaAlgeriaAngolaArab WorldArgentinaArmeniaAustraliaAustriaAzerbaijanBahrainBangladeshBelarusBelgiumBeninBoliviaBosnia and HerzegovinaBotswanaBrazilBrunei DarussalamBulgariaCambodiaCameroonCanadaCentral Europe and the BalticsChileChinaColombiaCongo, Dem. Rep.Congo, Rep.Costa RicaCote d'IvoireCroatiaCubaCuracaoCyprusCzech RepublicDenmarkDominican RepublicEarly-demographic dividendEast Asia & PacificEast Asia & Pacific (excluding high income)East Asia & Pacific (IDA & IBRD countries)EcuadorEgypt, Arab Rep.El SalvadorEritreaEstoniaEthiopiaEuro areaEurope & Central AsiaEurope & Central Asia (excluding high income)Europe & Central Asia (IDA & IBRD countries)European UnionFinlandFragile and conflict affected situationsFranceGabonGeorgiaGermanyGhanaGibraltarGreeceGuatemalaHaitiHeavily indebted poor countries (HIPC)High incomeHondurasHong Kong SAR, ChinaHungaryIBRD onlyIcelandIDA & IBRD totalIDA blendIDA onlyIDA totalIndiaIndonesiaIran, Islamic Rep.IraqIrelandIsraelItalyJamaicaJapanJordanKazakhstanKenyaKorea, Dem. People’s Rep.Korea, Rep.KosovoKuwaitKyrgyz RepublicLate-demographic dividendLatin America & Caribbean Latin America & Caribbean (excluding high income)Latin America & the Caribbean (IDA & IBRD countries)LatviaLeast developed countries: UN classificationLebanonLibyaLithuaniaLow & middle incomeLower middle incomeLuxembourgMacedonia, FYRMalaysiaMaltaMauritiusMexicoMiddle East & North AfricaMiddle East & North Africa (excluding high income)Middle East & North Africa (IDA & IBRD countries)Middle incomeMoldovaMongoliaMontenegroMoroccoMozambiqueMyanmarNamibiaNepalNetherlandsNew ZealandNicaraguaNigerNigeriaNorth AmericaNorwayOECD membersOmanPakistanPanamaParaguayPeruPhilippinesPolandPortugalPost-demographic dividendPre-demographic dividendQatarRomaniaRussian FederationSaudi ArabiaSenegalSerbiaSingaporeSlovak RepublicSloveniaSouth AfricaSouth AsiaSouth Asia (IDA & IBRD)South SudanSpainSri LankaSub-Saharan Africa Sub-Saharan Africa (excluding high income)Sub-Saharan Africa (IDA & IBRD countries)SudanSwedenSwitzerlandSyrian Arab RepublicTajikistanTanzaniaThailandTogoTrinidad and TobagoTunisiaTurkeyTurkmenistanUkraineUnited Arab EmiratesUnited KingdomUnited StatesUpper middle incomeUruguayUzbekistanVenezuela, RBVietnamWorldYemen, Rep.ZambiaZimbabwe La ligne de temps
Cette échelle de temps montre un graphique de 1972 année à 2014 année Angola. Les données jusqu'à 1971 année ne sont pas présentés. Quantité d'observations actuelles selon dates: 43.
Source (désignation):
Les indicateurs du développement mondiale
Source (organisation):
IEA Statistics © OECD/IEA 2014 (http://www.iea.org/stats/index.asp), subject to https://www.iea.org/t&c/termsandconditions/
Catégories:
Energy & Mining, Climate Change, Infrastructure
Dernière mise à jour
23 avr. 2017
Les indicateurs de changement de valeurs selon les années
Minimum:
52.673
1 janv. 1996
Maximum:
228.508
1 janv. 2012
Pour la date d''observation
Valeur
Changement absolu
Le changement par rapport à la valeur précédente
1 janv. 1972
86.367
+86.367
0.0%
1 janv. 1973
95.33
+8.963
10.38%
1 janv. 1974
109.33
+14.0
14.69%
1 janv. 1975
133.165
+23.835
21.8%
1 janv. 1976
137.745
+4.58
3.44%
1 janv. 1977
60.141
-77.604
-56.34%
1 janv. 1978
58.523
-1.618
-2.69%
1 janv. 1979
56.886
-1.637
-2.8%
1 janv. 1980
59.35
+2.463
4.33%
1 janv. 1981
61.618
+2.268
3.82%
1 janv. 1982
59.544
-2.074
-3.37%
1 janv. 1983
61.311
+1.768
2.97%
1 janv. 1984
64.303
+2.992
4.88%
1 janv. 1985
53.15
-11.153
-17.34%
1 janv. 1986
61.979
+8.829
16.61%
1 janv. 1987
60.257
-1.722
-2.78%
1 janv. 1988
59.014
-1.243
-2.06%
1 janv. 1989
57.943
-1.071
-1.82%
1 janv. 1990
56.742
-1.201
-2.07%
1 janv. 1991
56.615
-0.127
-0.22%
1 janv. 1992
58.141
+1.526
2.7%
1 janv. 1993
57.136
-1.005
-1.73%
1 janv. 1994
55.525
-1.611
-2.82%
1 janv. 1995
54.078
-1.447
-2.61%
1 janv. 1996
52.673
-1.404
-2.6%
1 janv. 1997
54.824
+2.151
4.08%
1 janv. 1998
74.7
+19.876
36.25%
1 janv. 1999
79.364
+4.664
6.24%
1 janv. 2000
78.14
-1.224
-1.54%
1 janv. 2001
81.946
+3.806
4.87%
1 janv. 2002
89.958
+8.012
9.78%
1 janv. 2003
93.546
+3.588
3.99%
1 janv. 2004
104.066
+10.519
11.25%
1 janv. 2005
94.938
-9.128
-8.77%
1 janv. 2006
118.573
+23.635
24.9%
1 janv. 2007
157.269
+38.696
32.63%
1 janv. 2008
145.226
-12.043
-7.66%
1 janv. 2009
188.487
+43.261
29.79%
1 janv. 2010
207.65
+19.163
10.17%
1 janv. 2011
227.239
+19.589
9.43%
1 janv. 2012
228.508
+1.27
0.56%
1 janv. 2013
219.522
-8.986
-3.93%
1 janv. 2014
226.84
+7.318
3.33%
Classement des pays selon les statistiques actuelles par années


Commentaires: