29
/fr/
fr
AIzaSyAYiBZKx7MnpbEhh9jyipgxe19OcubqV5w
April 1, 2024
57994
South Asia (IDA & IBRD)
TSA
false
2
1
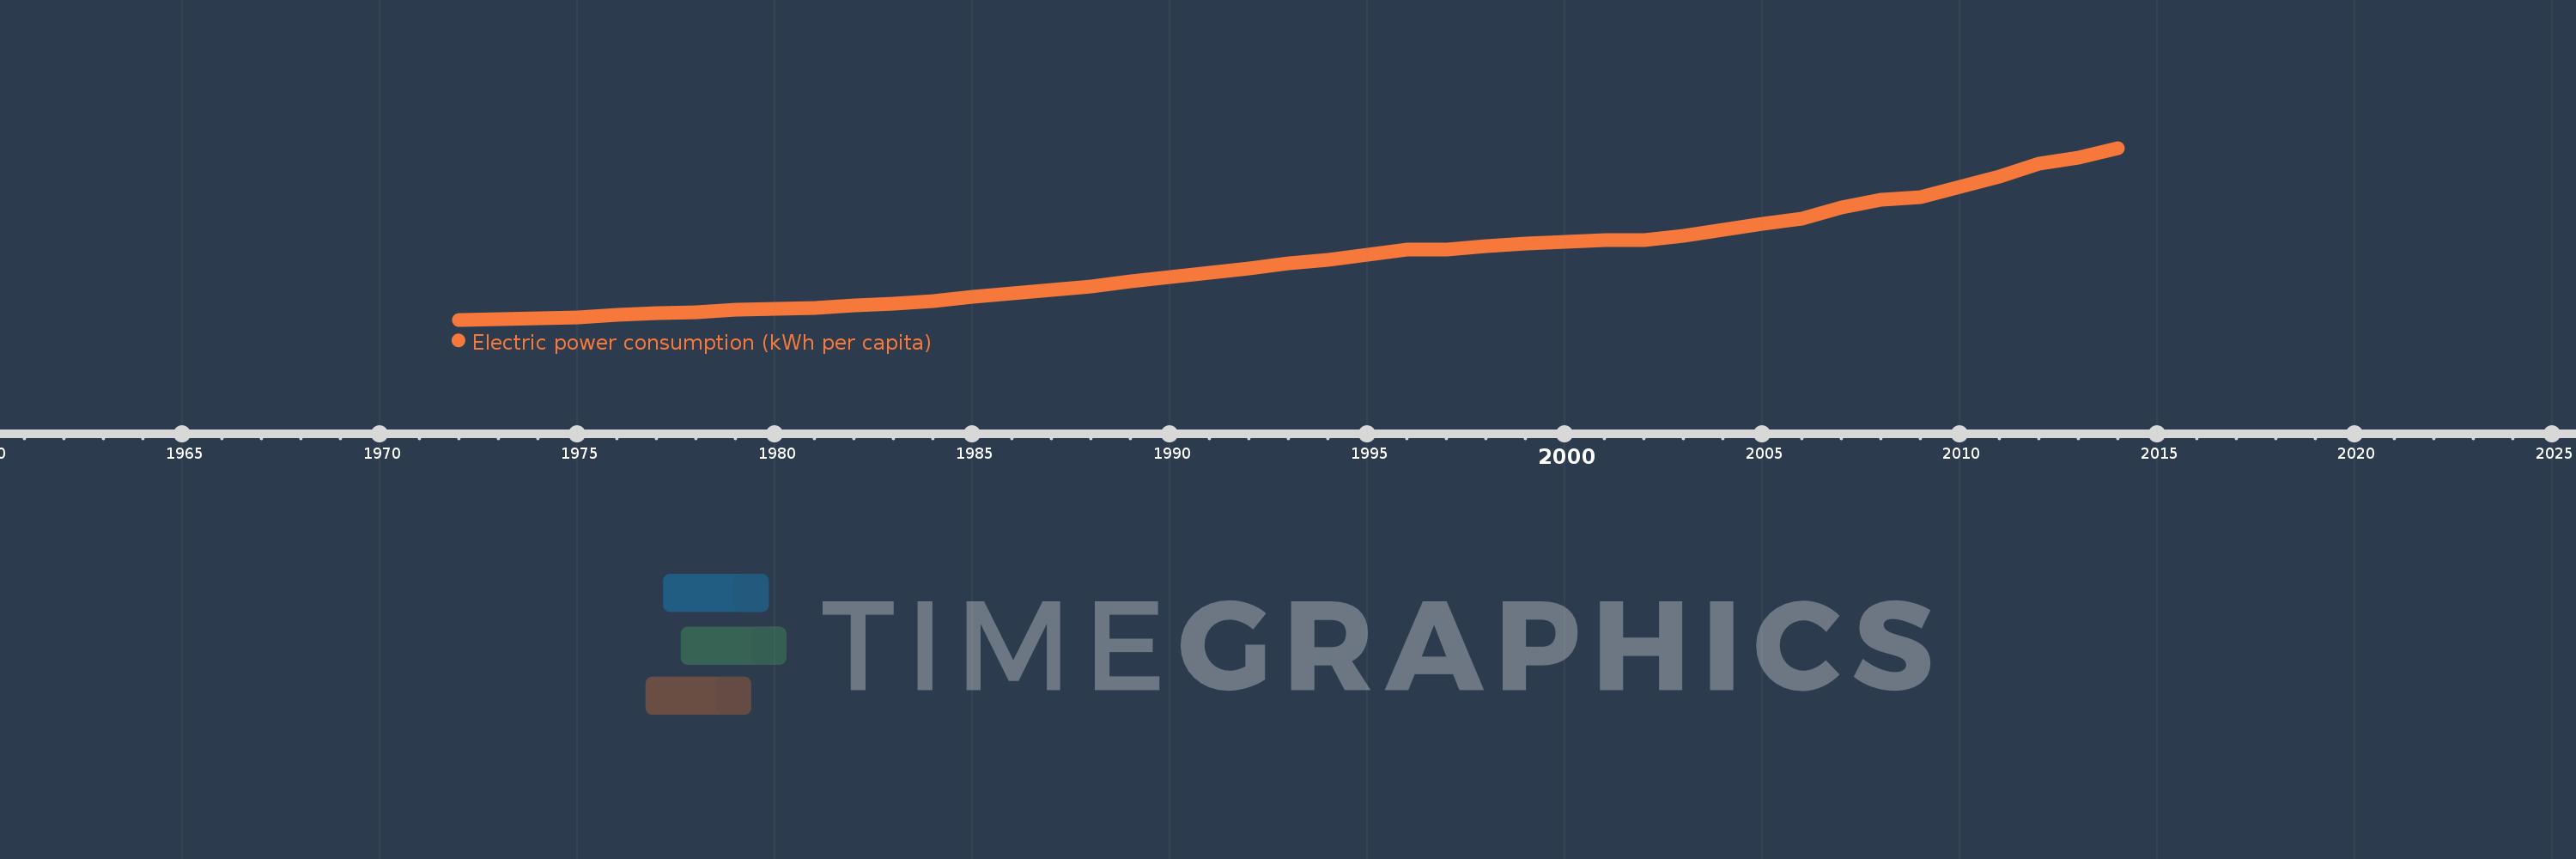
Electric power consumption (kWh per capita)
2014,2013,2012,2011,2010,2009,2008,2007,2006,2005,2004,2003,2002,2001,2000,1999,1998,1997,1996,1995,1994,1993,1992,1991,1990,1989,1988,1987,1986,1985,1984,1983,1982,1981,1980,1979,1978,1977,1976,1975,1974,1973,1972
Cette statistique dans les autres pays:
AlbaniaAlgeriaAngolaArab WorldArgentinaArmeniaAustraliaAustriaAzerbaijanBahrainBangladeshBelarusBelgiumBeninBoliviaBosnia and HerzegovinaBotswanaBrazilBrunei DarussalamBulgariaCambodiaCameroonCanadaCentral Europe and the BalticsChileChinaColombiaCongo, Dem. Rep.Congo, Rep.Costa RicaCote d'IvoireCroatiaCubaCuracaoCyprusCzech RepublicDenmarkDominican RepublicEarly-demographic dividendEast Asia & PacificEast Asia & Pacific (excluding high income)East Asia & Pacific (IDA & IBRD countries)EcuadorEgypt, Arab Rep.El SalvadorEritreaEstoniaEthiopiaEuro areaEurope & Central AsiaEurope & Central Asia (excluding high income)Europe & Central Asia (IDA & IBRD countries)European UnionFinlandFragile and conflict affected situationsFranceGabonGeorgiaGermanyGhanaGibraltarGreeceGuatemalaHaitiHeavily indebted poor countries (HIPC)High incomeHondurasHong Kong SAR, ChinaHungaryIBRD onlyIcelandIDA & IBRD totalIDA blendIDA onlyIDA totalIndiaIndonesiaIran, Islamic Rep.IraqIrelandIsraelItalyJamaicaJapanJordanKazakhstanKenyaKorea, Dem. People’s Rep.Korea, Rep.KosovoKuwaitKyrgyz RepublicLate-demographic dividendLatin America & Caribbean Latin America & Caribbean (excluding high income)Latin America & the Caribbean (IDA & IBRD countries)LatviaLeast developed countries: UN classificationLebanonLibyaLithuaniaLow & middle incomeLower middle incomeLuxembourgMacedonia, FYRMalaysiaMaltaMauritiusMexicoMiddle East & North AfricaMiddle East & North Africa (excluding high income)Middle East & North Africa (IDA & IBRD countries)Middle incomeMoldovaMongoliaMontenegroMoroccoMozambiqueMyanmarNamibiaNepalNetherlandsNew ZealandNicaraguaNigerNigeriaNorth AmericaNorwayOECD membersOmanPakistanPanamaParaguayPeruPhilippinesPolandPortugalPost-demographic dividendPre-demographic dividendQatarRomaniaRussian FederationSaudi ArabiaSenegalSerbiaSingaporeSlovak RepublicSloveniaSouth AfricaSouth AsiaSouth Asia (IDA & IBRD)South SudanSpainSri LankaSub-Saharan Africa Sub-Saharan Africa (excluding high income)Sub-Saharan Africa (IDA & IBRD countries)SudanSwedenSwitzerlandSyrian Arab RepublicTajikistanTanzaniaThailandTogoTrinidad and TobagoTunisiaTurkeyTurkmenistanUkraineUnited Arab EmiratesUnited KingdomUnited StatesUpper middle incomeUruguayUzbekistanVenezuela, RBVietnamWorldYemen, Rep.ZambiaZimbabwe La ligne de temps
Cette échelle de temps montre un graphique de 1972 année à 2014 année South Asia (IDA & IBRD). Les données jusqu'à 1971 année ne sont pas présentés. Quantité d'observations actuelles selon dates: 43.
Source (désignation):
Les indicateurs du développement mondiale
Source (organisation):
IEA Statistics © OECD/IEA 2014 (http://www.iea.org/stats/index.asp), subject to https://www.iea.org/t&c/termsandconditions/
Catégories:
Energy & Mining, Climate Change, Infrastructure
Dernière mise à jour
23 avr. 2017
Les indicateurs de changement de valeurs selon les années
Minimum:
87.266
1 janv. 1972
Maximum:
672.638
1 janv. 2014
Pour la date d''observation
Valeur
Changement absolu
Le changement par rapport à la valeur précédente
1 janv. 1972
87.266
+87.266
0.0%
1 janv. 1973
89.242
+1.977
2.26%
1 janv. 1974
90.862
+1.62
1.82%
1 janv. 1975
94.282
+3.42
3.76%
1 janv. 1976
103.093
+8.811
9.35%
1 janv. 1977
110.491
+7.398
7.18%
1 janv. 1978
112.496
+2.004
1.81%
1 janv. 1979
121.512
+9.017
8.02%
1 janv. 1980
123.021
+1.509
1.24%
1 janv. 1981
127.269
+4.248
3.45%
1 janv. 1982
136.783
+9.514
7.48%
1 janv. 1983
143.183
+6.401
4.68%
1 janv. 1984
150.636
+7.453
5.21%
1 janv. 1985
165.958
+15.321
10.17%
1 janv. 1986
175.658
+9.701
5.85%
1 janv. 1987
188.963
+13.305
7.57%
1 janv. 1988
200.013
+11.05
5.85%
1 janv. 1989
218.396
+18.384
9.19%
1 janv. 1990
233.229
+14.833
6.79%
1 janv. 1991
246.316
+13.087
5.61%
1 janv. 1992
263.069
+16.753
6.8%
1 janv. 1993
278.176
+15.107
5.74%
1 janv. 1994
291.691
+13.515
4.86%
1 janv. 1995
309.427
+17.735
6.08%
1 janv. 1996
325.186
+15.759
5.09%
1 janv. 1997
326.327
+1.141
0.35%
1 janv. 1998
339.314
+12.987
3.98%
1 janv. 1999
346.208
+6.894
2.03%
1 janv. 2000
353.205
+6.997
2.02%
1 janv. 2001
357.257
+4.052
1.15%
1 janv. 2002
358.985
+1.728
0.48%
1 janv. 2003
373.63
+14.645
4.08%
1 janv. 2004
392.516
+18.886
5.05%
1 janv. 2005
414.69
+22.174
5.65%
1 janv. 2006
432.628
+17.937
4.33%
1 janv. 2007
469.146
+36.518
8.44%
1 janv. 2008
494.956
+25.811
5.5%
1 janv. 2009
506.261
+11.305
2.28%
1 janv. 2010
539.694
+33.433
6.6%
1 janv. 2011
575.454
+35.76
6.63%
1 janv. 2012
618.749
+43.295
7.52%
1 janv. 2013
640.06
+21.312
3.44%
1 janv. 2014
672.638
+32.578
5.09%
Classement des pays selon les statistiques actuelles par années


Commentaires: