29
/fr/
fr
AIzaSyAYiBZKx7MnpbEhh9jyipgxe19OcubqV5w
April 1, 2024
67439
Angola
AGO
true
2
1
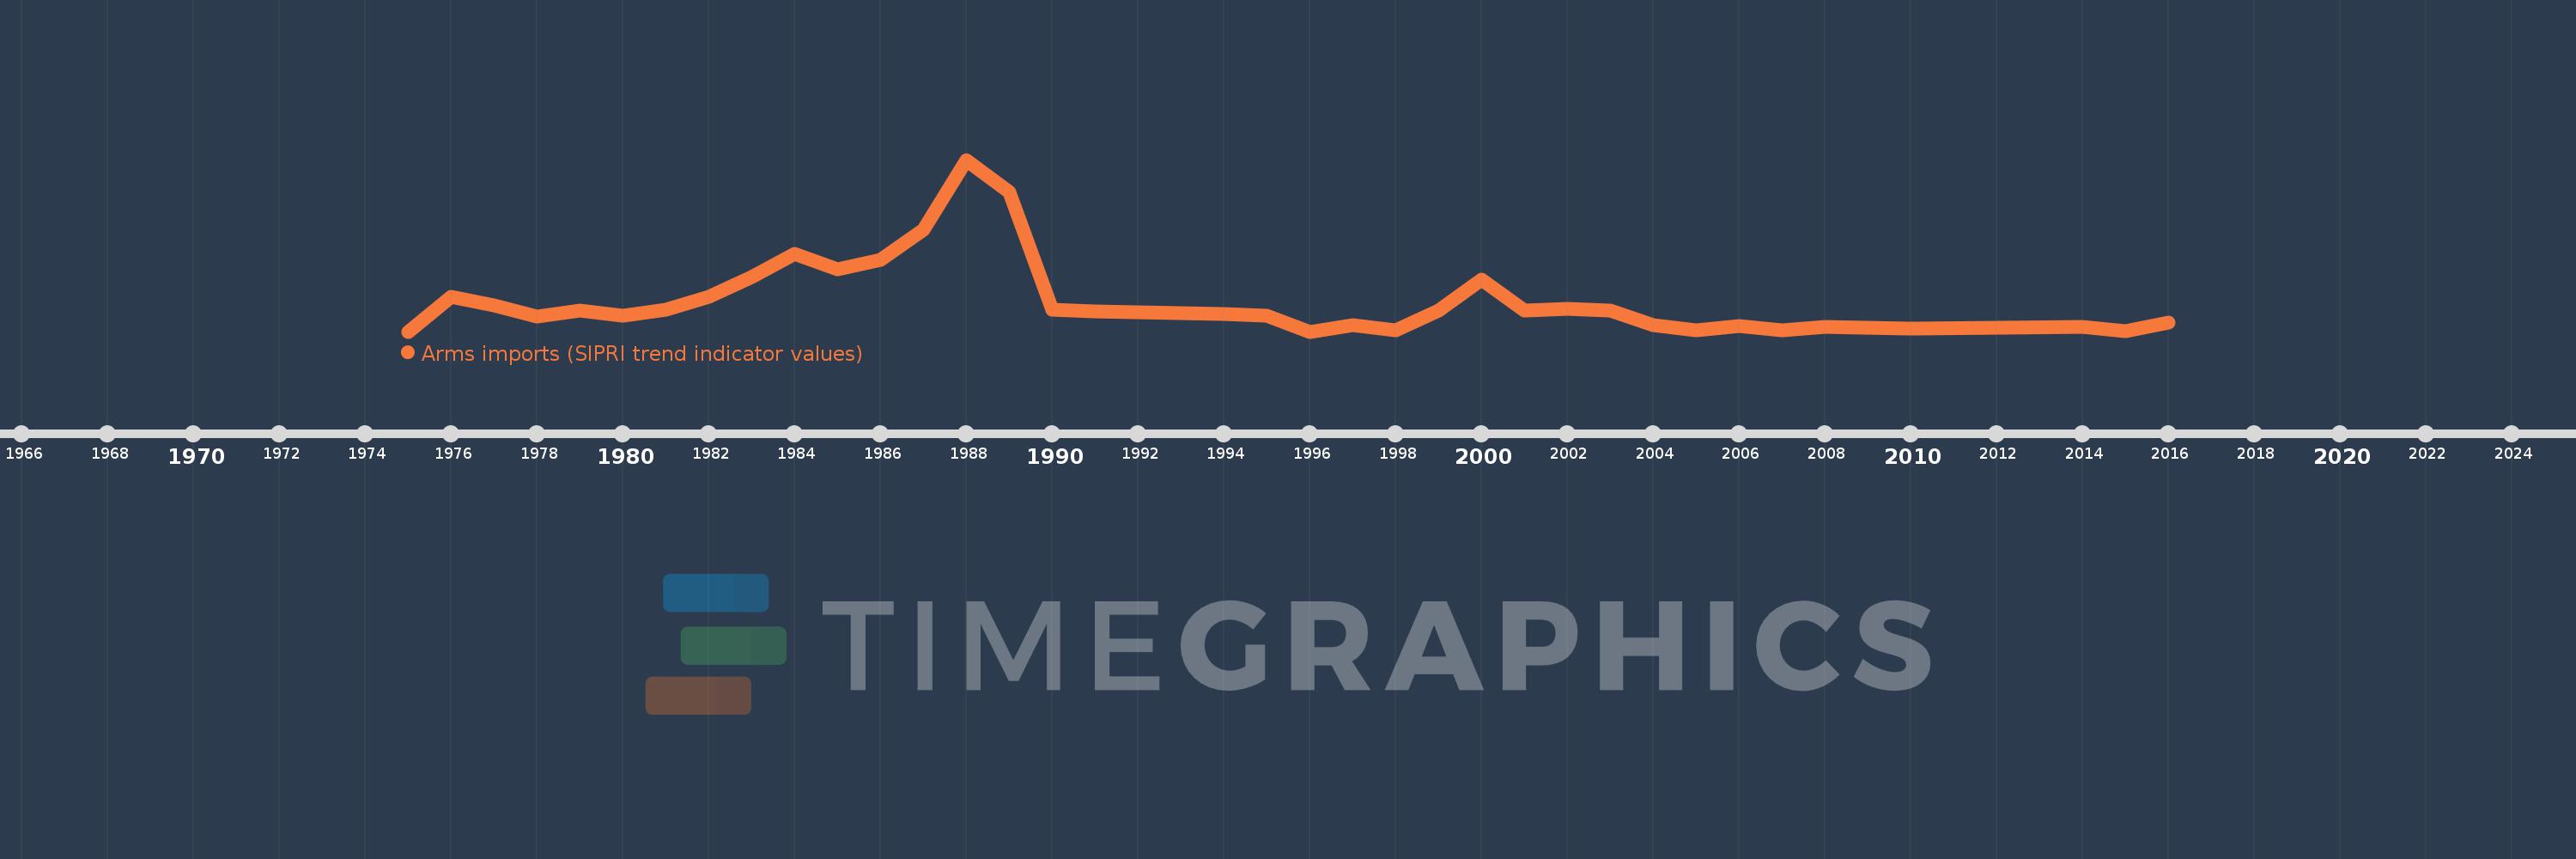
Arms imports (SIPRI trend indicator values)
2016,2015,2014,2010,2009,2008,2007,2006,2005,2004,2003,2002,2001,2000,1999,1998,1997,1996,1995,1994,1991,1990,1989,1988,1987,1986,1985,1984,1983,1982,1981,1980,1979,1978,1977,1976,1975
Cette statistique dans les autres pays:
AfghanistanAlbaniaAlgeriaAngolaArab WorldArgentinaArmeniaAustraliaAustriaAzerbaijanBahamas, TheBahrainBangladeshBarbadosBelarusBelgiumBelizeBeninBhutanBoliviaBosnia and HerzegovinaBotswanaBrazilBrunei DarussalamBulgariaBurkina FasoBurundiCabo VerdeCambodiaCameroonCanadaCaribbean small statesCentral African RepublicCentral Europe and the BalticsChadChileChinaColombiaComorosCongo, Dem. Rep.Congo, Rep.Costa RicaCote d'IvoireCroatiaCubaCyprusCzech RepublicDenmarkDjiboutiDominican RepublicEarly-demographic dividendEast Asia & PacificEast Asia & Pacific (excluding high income)East Asia & Pacific (IDA & IBRD countries)EcuadorEgypt, Arab Rep.El SalvadorEquatorial GuineaEritreaEstoniaEthiopiaEuro areaEurope & Central AsiaEurope & Central Asia (excluding high income)Europe & Central Asia (IDA & IBRD countries)European UnionFijiFinlandFragile and conflict affected situationsFranceGabonGambia, TheGeorgiaGermanyGhanaGreeceGrenadaGuatemalaGuineaGuinea-BissauGuyanaHaitiHeavily indebted poor countries (HIPC)High incomeHondurasHungaryIBRD onlyIcelandIDA & IBRD totalIDA blendIDA onlyIDA totalIndiaIndonesiaIran, Islamic Rep.IraqIrelandIsraelItalyJamaicaJapanJordanKazakhstanKenyaKiribatiKorea, Dem. People’s Rep.Korea, Rep.KosovoKuwaitKyrgyz RepublicLao PDRLate-demographic dividendLatin America & Caribbean Latin America & Caribbean (excluding high income)Latin America & the Caribbean (IDA & IBRD countries)LatviaLeast developed countries: UN classificationLebanonLesothoLiberiaLibyaLithuaniaLow & middle incomeLow incomeLower middle incomeLuxembourgMacedonia, FYRMadagascarMalawiMalaysiaMaldivesMaliMaltaMarshall IslandsMauritaniaMauritiusMexicoMicronesia, Fed. Sts.Middle East & North AfricaMiddle East & North Africa (excluding high income)Middle East & North Africa (IDA & IBRD countries)Middle incomeMoldovaMongoliaMoroccoMozambiqueMyanmarNamibiaNepalNetherlandsNew ZealandNicaraguaNigerNigeriaNorth AmericaNorwayOECD membersOmanOther small statesPacific island small statesPakistanPalauPanamaPapua New GuineaParaguayPeruPhilippinesPolandPortugalPost-demographic dividendPre-demographic dividendQatarRomaniaRussian FederationRwandaSamoaSaudi ArabiaSenegalSerbiaSeychellesSierra LeoneSingaporeSlovak RepublicSloveniaSmall statesSolomon IslandsSomaliaSouth AfricaSouth AsiaSouth Asia (IDA & IBRD)South SudanSpainSri LankaSt. Kitts and NevisSt. Vincent and the GrenadinesSub-Saharan Africa Sub-Saharan Africa (excluding high income)Sub-Saharan Africa (IDA & IBRD countries)SudanSurinameSwazilandSwedenSwitzerlandSyrian Arab RepublicTajikistanTanzaniaThailandTimor-LesteTogoTongaTrinidad and TobagoTunisiaTurkeyTurkmenistanTuvaluUgandaUkraineUnited Arab EmiratesUnited KingdomUnited StatesUpper middle incomeUruguayUzbekistanVanuatuVenezuela, RBVietnamWest Bank and GazaWorldYemen, Rep.ZambiaZimbabwe La ligne de temps
Cette échelle de temps montre un graphique de 1975 année à 2016 année Angola. Les données jusqu'à 1974 année ne sont pas présentés. Quantité d'observations actuelles selon dates: 37.
Source (désignation):
Les indicateurs du développement mondiale
Source (organisation):
Stockholm International Peace Research Institute (SIPRI), Arms Transfers Programme (http://portal.sipri.org/publications/pages/transfer/splash).
Catégories:
Public Sector, Trade
Dernière mise à jour
23 avr. 2017
Les indicateurs de changement de valeurs selon les années
Minimum:
1000.0 milles
1 janv. 1975
Maximum:
1.186 mds
1 janv. 1988
Pour la date d''observation
Valeur
Changement absolu
Le changement par rapport à la valeur précédente
1 janv. 1975
1000.0 milles
+1000.0 milles
0.0%
1 janv. 1976
240.0 mln.
+239.0 mln.
23.9 milles%
1 janv. 1977
184.0 mln.
-56.0 mln.
-23.33%
1 janv. 1978
105.0 mln.
-79.0 mln.
-42.93%
1 janv. 1979
146.0 mln.
+41.0 mln.
39.05%
1 janv. 1980
111.0 mln.
-35.0 mln.
-23.97%
1 janv. 1981
155.0 mln.
+44.0 mln.
39.64%
1 janv. 1982
241.0 mln.
+86.0 mln.
55.48%
1 janv. 1983
379.0 mln.
+138.0 mln.
57.26%
1 janv. 1984
538.0 mln.
+159.0 mln.
41.95%
1 janv. 1985
430.0 mln.
-108.0 mln.
-20.07%
1 janv. 1986
493.0 mln.
+63.0 mln.
14.65%
1 janv. 1987
705.0 mln.
+212.0 mln.
43.0%
1 janv. 1988
1.186 mds
+481.0 mln.
68.23%
1 janv. 1989
962.0 mln.
-224.0 mln.
-18.89%
1 janv. 1990
152.0 mln.
-810.0 mln.
-84.2%
1 janv. 1991
140.0 mln.
-12.0 mln.
-7.89%
1 janv. 1994
122.0 mln.
-18.0 mln.
-12.86%
1 janv. 1995
111.0 mln.
-11.0 mln.
-9.02%
1 janv. 1996
1000.0 milles
-110.0 mln.
-99.1%
1 janv. 1997
44.0 mln.
+43.0 mln.
4.3 milles%
1 janv. 1998
7.0 mln.
-37.0 mln.
-84.09%
1 janv. 1999
149.0 mln.
+142.0 mln.
2.03 milles%
1 janv. 2000
358.0 mln.
+209.0 mln.
140.27%
1 janv. 2001
147.0 mln.
-211.0 mln.
-58.94%
1 janv. 2002
156.0 mln.
+9.0 mln.
6.12%
1 janv. 2003
148.0 mln.
-8.0 mln.
-5.13%
1 janv. 2004
48.0 mln.
-100.0 mln.
-67.57%
1 janv. 2005
8.0 mln.
-40.0 mln.
-83.33%
1 janv. 2006
39.0 mln.
+31.0 mln.
387.5%
1 janv. 2007
7.0 mln.
-32.0 mln.
-82.05%
1 janv. 2008
31.0 mln.
+24.0 mln.
342.86%
1 janv. 2009
29.0 mln.
-2.0 mln.
-6.45%
1 janv. 2010
20.0 mln.
-9.0 mln.
-31.03%
1 janv. 2014
31.0 mln.
+11.0 mln.
55.0%
1 janv. 2015
2.0 mln.
-29.0 mln.
-93.55%
1 janv. 2016
61.0 mln.
+59.0 mln.
2.95 milles%
Classement des pays selon les statistiques actuelles par années


Commentaires: