29
/fr/
fr
AIzaSyAYiBZKx7MnpbEhh9jyipgxe19OcubqV5w
April 1, 2024
274549
United Arab Emirates
ARE
true
2
1
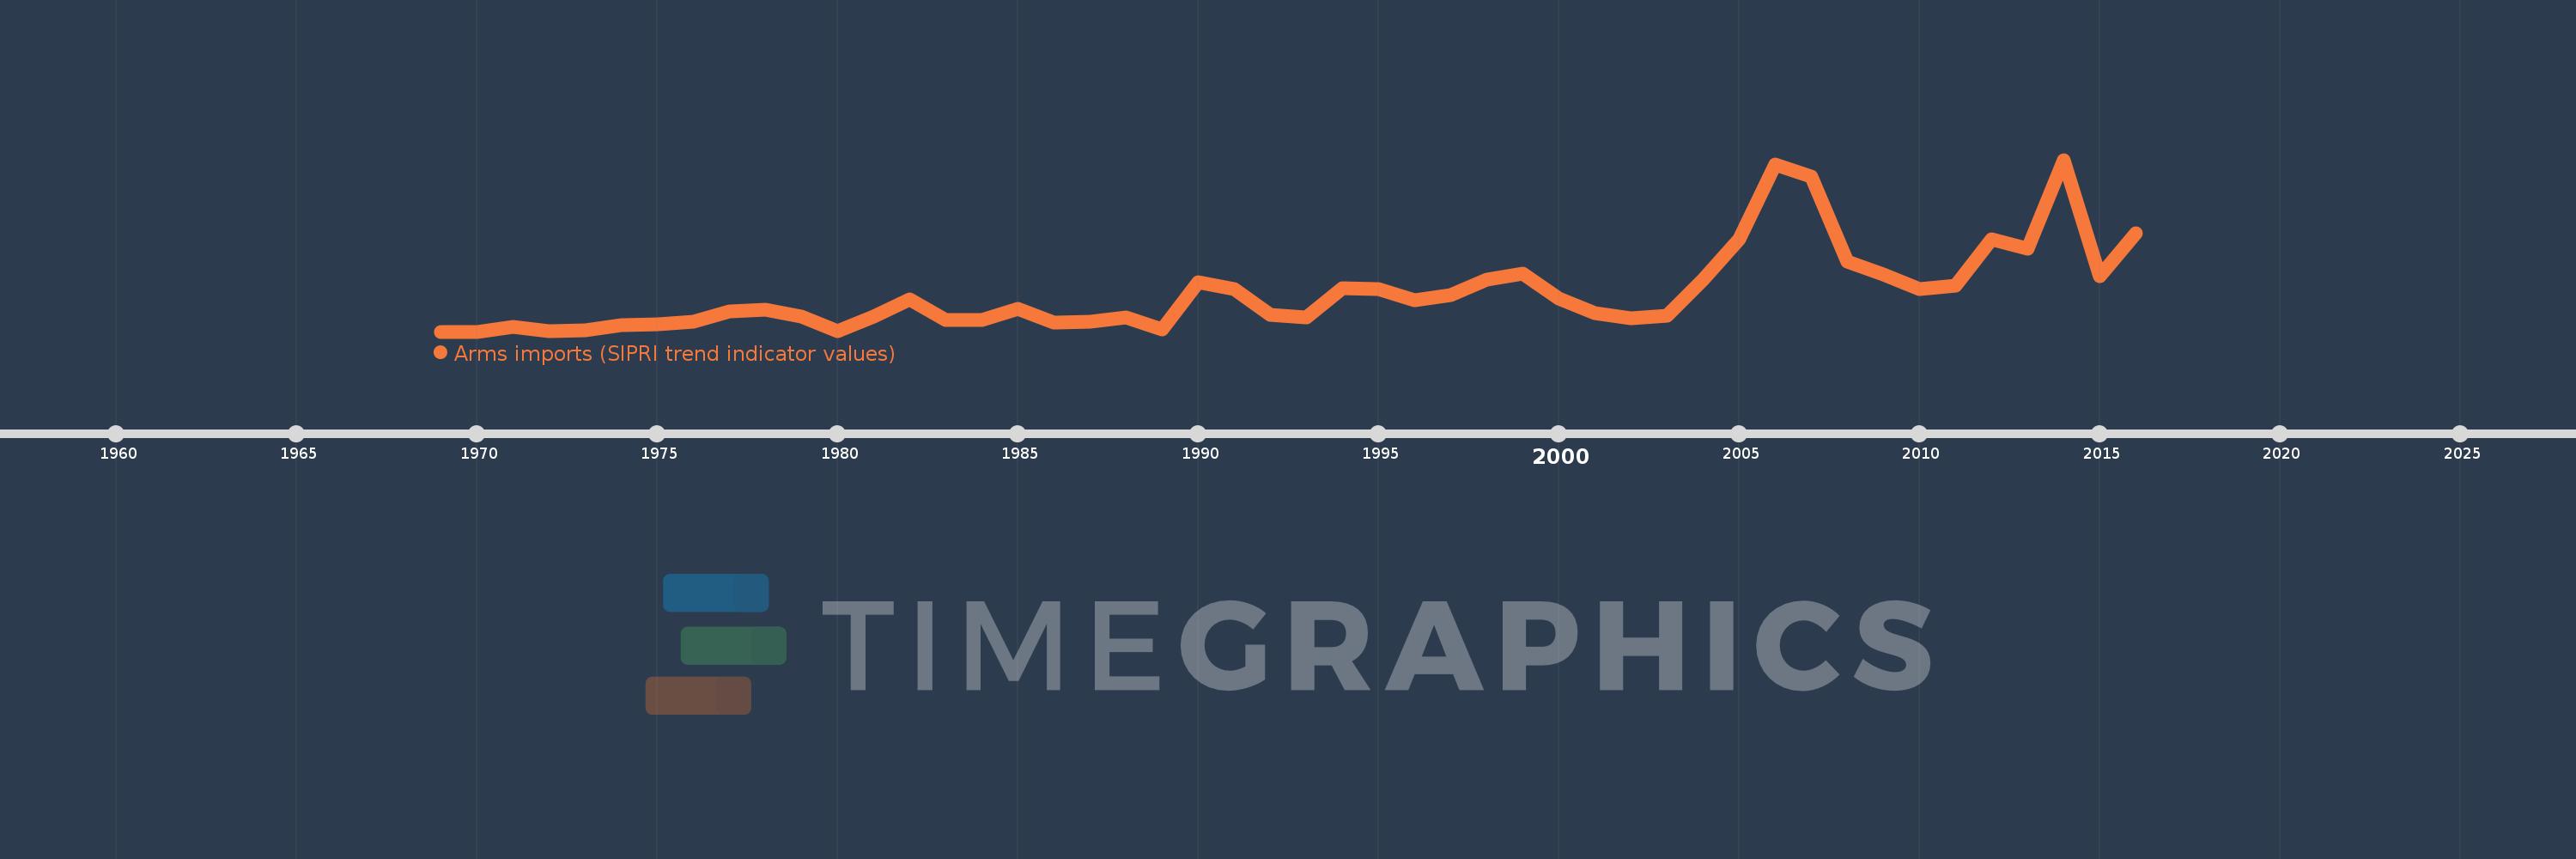
Arms imports (SIPRI trend indicator values)
2016,2015,2014,2013,2012,2011,2010,2009,2008,2007,2006,2005,2004,2003,2002,2001,2000,1999,1998,1997,1996,1995,1994,1993,1992,1991,1990,1989,1988,1987,1986,1985,1984,1983,1982,1981,1980,1979,1978,1977,1976,1975,1974,1973,1972,1971,1970,1969
Cette statistique dans les autres pays:
AfghanistanAlbaniaAlgeriaAngolaArab WorldArgentinaArmeniaAustraliaAustriaAzerbaijanBahamas, TheBahrainBangladeshBarbadosBelarusBelgiumBelizeBeninBhutanBoliviaBosnia and HerzegovinaBotswanaBrazilBrunei DarussalamBulgariaBurkina FasoBurundiCabo VerdeCambodiaCameroonCanadaCaribbean small statesCentral African RepublicCentral Europe and the BalticsChadChileChinaColombiaComorosCongo, Dem. Rep.Congo, Rep.Costa RicaCote d'IvoireCroatiaCubaCyprusCzech RepublicDenmarkDjiboutiDominican RepublicEarly-demographic dividendEast Asia & PacificEast Asia & Pacific (excluding high income)East Asia & Pacific (IDA & IBRD countries)EcuadorEgypt, Arab Rep.El SalvadorEquatorial GuineaEritreaEstoniaEthiopiaEuro areaEurope & Central AsiaEurope & Central Asia (excluding high income)Europe & Central Asia (IDA & IBRD countries)European UnionFijiFinlandFragile and conflict affected situationsFranceGabonGambia, TheGeorgiaGermanyGhanaGreeceGrenadaGuatemalaGuineaGuinea-BissauGuyanaHaitiHeavily indebted poor countries (HIPC)High incomeHondurasHungaryIBRD onlyIcelandIDA & IBRD totalIDA blendIDA onlyIDA totalIndiaIndonesiaIran, Islamic Rep.IraqIrelandIsraelItalyJamaicaJapanJordanKazakhstanKenyaKiribatiKorea, Dem. People’s Rep.Korea, Rep.KosovoKuwaitKyrgyz RepublicLao PDRLate-demographic dividendLatin America & Caribbean Latin America & Caribbean (excluding high income)Latin America & the Caribbean (IDA & IBRD countries)LatviaLeast developed countries: UN classificationLebanonLesothoLiberiaLibyaLithuaniaLow & middle incomeLow incomeLower middle incomeLuxembourgMacedonia, FYRMadagascarMalawiMalaysiaMaldivesMaliMaltaMarshall IslandsMauritaniaMauritiusMexicoMicronesia, Fed. Sts.Middle East & North AfricaMiddle East & North Africa (excluding high income)Middle East & North Africa (IDA & IBRD countries)Middle incomeMoldovaMongoliaMoroccoMozambiqueMyanmarNamibiaNepalNetherlandsNew ZealandNicaraguaNigerNigeriaNorth AmericaNorwayOECD membersOmanOther small statesPacific island small statesPakistanPalauPanamaPapua New GuineaParaguayPeruPhilippinesPolandPortugalPost-demographic dividendPre-demographic dividendQatarRomaniaRussian FederationRwandaSamoaSaudi ArabiaSenegalSerbiaSeychellesSierra LeoneSingaporeSlovak RepublicSloveniaSmall statesSolomon IslandsSomaliaSouth AfricaSouth AsiaSouth Asia (IDA & IBRD)South SudanSpainSri LankaSt. Kitts and NevisSt. Vincent and the GrenadinesSub-Saharan Africa Sub-Saharan Africa (excluding high income)Sub-Saharan Africa (IDA & IBRD countries)SudanSurinameSwazilandSwedenSwitzerlandSyrian Arab RepublicTajikistanTanzaniaThailandTimor-LesteTogoTongaTrinidad and TobagoTunisiaTurkeyTurkmenistanTuvaluUgandaUkraineUnited Arab EmiratesUnited KingdomUnited StatesUpper middle incomeUruguayUzbekistanVanuatuVenezuela, RBVietnamWest Bank and GazaWorldYemen, Rep.ZambiaZimbabwe La ligne de temps
Cette échelle de temps montre un graphique de 1969 année à 2016 année United Arab Emirates. Les données jusqu'à 1968 année ne sont pas présentés. Quantité d'observations actuelles selon dates: 48.
Source (désignation):
Les indicateurs du développement mondiale
Source (organisation):
Stockholm International Peace Research Institute (SIPRI), Arms Transfers Programme (http://portal.sipri.org/publications/pages/transfer/splash).
Catégories:
Public Sector, Trade
Dernière mise à jour
23 avr. 2017
Les indicateurs de changement de valeurs selon les années
Minimum:
13.0 mln.
1 janv. 1969
Maximum:
2.235 mds
1 janv. 2014
Pour la date d''observation
Valeur
Changement absolu
Le changement par rapport à la valeur précédente
1 janv. 1969
13.0 mln.
+13.0 mln.
0.0%
1 janv. 1970
13.0 mln.
0.0
0.0%
1 janv. 1971
69.0 mln.
+56.0 mln.
430.77%
1 janv. 1972
24.0 mln.
-45.0 mln.
-65.22%
1 janv. 1973
26.0 mln.
+2.0 mln.
8.33%
1 janv. 1974
93.0 mln.
+67.0 mln.
257.69%
1 janv. 1975
106.0 mln.
+13.0 mln.
13.98%
1 janv. 1976
144.0 mln.
+38.0 mln.
35.85%
1 janv. 1977
270.0 mln.
+126.0 mln.
87.5%
1 janv. 1978
294.0 mln.
+24.0 mln.
8.89%
1 janv. 1979
207.0 mln.
-87.0 mln.
-29.59%
1 janv. 1980
18.0 mln.
-189.0 mln.
-91.3%
1 janv. 1981
203.0 mln.
+185.0 mln.
1.03 milles%
1 janv. 1982
430.0 mln.
+227.0 mln.
111.82%
1 janv. 1983
159.0 mln.
-271.0 mln.
-63.02%
1 janv. 1984
164.0 mln.
+5.0 mln.
3.14%
1 janv. 1985
312.0 mln.
+148.0 mln.
90.24%
1 janv. 1986
128.0 mln.
-184.0 mln.
-58.97%
1 janv. 1987
137.0 mln.
+9.0 mln.
7.03%
1 janv. 1988
201.0 mln.
+64.0 mln.
46.72%
1 janv. 1989
46.0 mln.
-155.0 mln.
-77.11%
1 janv. 1990
652.0 mln.
+606.0 mln.
1.32 milles%
1 janv. 1991
559.0 mln.
-93.0 mln.
-14.26%
1 janv. 1992
235.0 mln.
-324.0 mln.
-57.96%
1 janv. 1993
201.0 mln.
-34.0 mln.
-14.47%
1 janv. 1994
579.0 mln.
+378.0 mln.
188.06%
1 janv. 1995
566.0 mln.
-13.0 mln.
-2.25%
1 janv. 1996
421.0 mln.
-145.0 mln.
-25.62%
1 janv. 1997
480.0 mln.
+59.0 mln.
14.01%
1 janv. 1998
688.0 mln.
+208.0 mln.
43.33%
1 janv. 1999
758.0 mln.
+70.0 mln.
10.17%
1 janv. 2000
437.0 mln.
-321.0 mln.
-42.35%
1 janv. 2001
247.0 mln.
-190.0 mln.
-43.48%
1 janv. 2002
186.0 mln.
-61.0 mln.
-24.7%
1 janv. 2003
222.0 mln.
+36.0 mln.
19.35%
1 janv. 2004
685.0 mln.
+463.0 mln.
208.56%
1 janv. 2005
1.21 mds
+525.0 mln.
76.64%
1 janv. 2006
2.17 mds
+960.0 mln.
79.34%
1 janv. 2007
2.021 mds
-149.0 mln.
-6.87%
1 janv. 2008
919.0 mln.
-1.102 mds
-54.53%
1 janv. 2009
752.0 mln.
-167.0 mln.
-18.17%
1 janv. 2010
561.0 mln.
-191.0 mln.
-25.4%
1 janv. 2011
605.0 mln.
+44.0 mln.
7.84%
1 janv. 2012
1.21 mds
+605.0 mln.
100.0%
1 janv. 2013
1.088 mds
-122.0 mln.
-10.08%
1 janv. 2014
2.235 mds
+1.147 mds
105.42%
1 janv. 2015
731.0 mln.
-1.504 mds
-67.29%
1 janv. 2016
1.289 mds
+558.0 mln.
76.33%
Classement des pays selon les statistiques actuelles par années


Commentaires: