29
/fr/
fr
AIzaSyAYiBZKx7MnpbEhh9jyipgxe19OcubqV5w
April 1, 2024
65721
Algeria
DZA
true
2
1
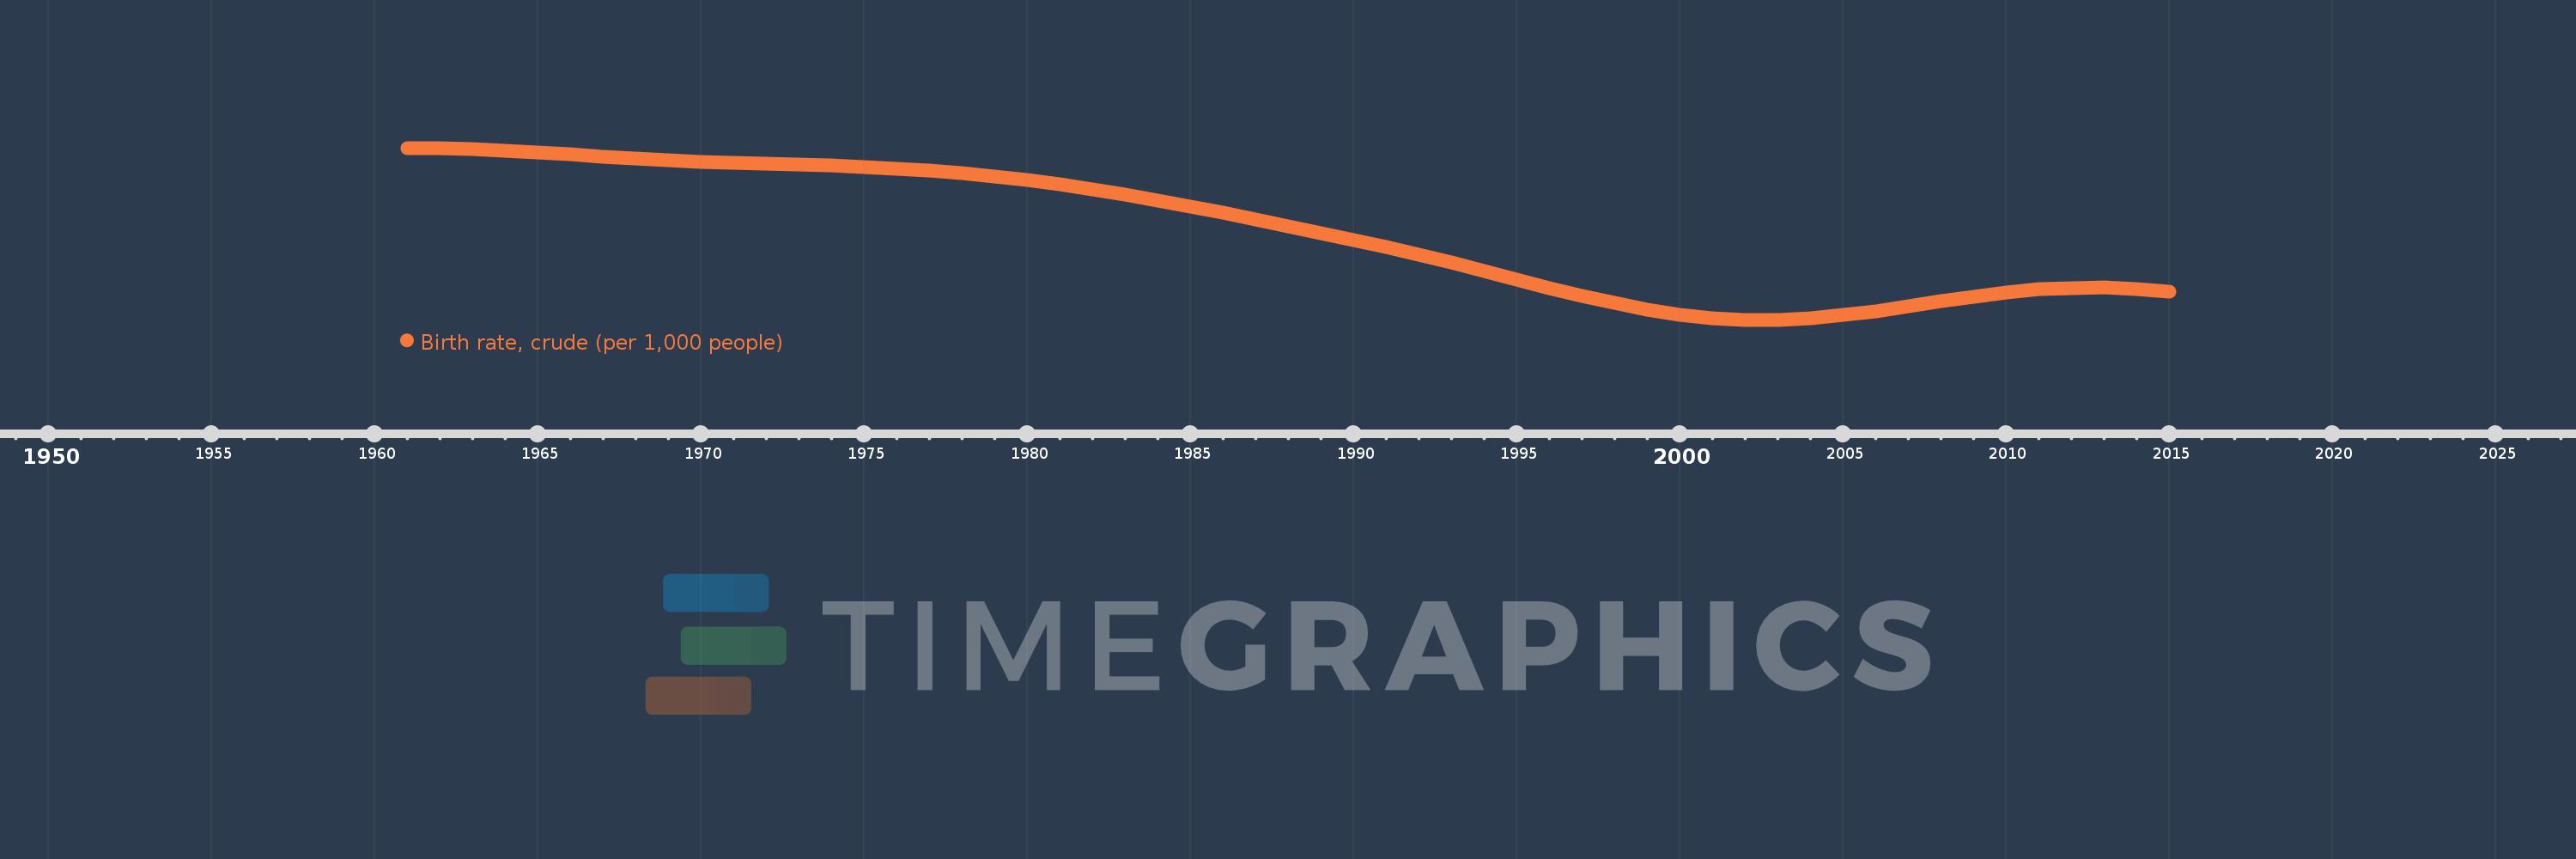
Birth rate, crude (per 1,000 people)
2015,2014,2013,2012,2011,2010,2009,2008,2007,2006,2005,2004,2003,2002,2001,2000,1999,1998,1997,1996,1995,1994,1993,1992,1991,1990,1989,1988,1987,1986,1985,1984,1983,1982,1981,1980,1979,1978,1977,1976,1975,1974,1973,1972,1971,1970,1969,1968,1967,1966,1965,1964,1963,1962,1961
Cette statistique dans les autres pays:
AfghanistanAlbaniaAlgeriaAmerican SamoaAndorraAngolaAntigua and BarbudaArab WorldArgentinaArmeniaArubaAustraliaAustriaAzerbaijanBahamas, TheBahrainBangladeshBarbadosBelarusBelgiumBelizeBeninBermudaBhutanBoliviaBosnia and HerzegovinaBotswanaBrazilBrunei DarussalamBulgariaBurkina FasoBurundiCabo VerdeCambodiaCameroonCanadaCaribbean small statesCayman IslandsCentral African RepublicCentral Europe and the BalticsChadChannel IslandsChileChinaColombiaComorosCongo, Dem. Rep.Congo, Rep.Costa RicaCote d'IvoireCroatiaCubaCuracaoCyprusCzech RepublicDenmarkDjiboutiDominicaDominican RepublicEarly-demographic dividendEast Asia & PacificEast Asia & Pacific (excluding high income)East Asia & Pacific (IDA & IBRD countries)EcuadorEgypt, Arab Rep.El SalvadorEquatorial GuineaEritreaEstoniaEthiopiaEuro areaEurope & Central AsiaEurope & Central Asia (excluding high income)Europe & Central Asia (IDA & IBRD countries)European UnionFaroe IslandsFijiFinlandFragile and conflict affected situationsFranceFrench PolynesiaGabonGambia, TheGeorgiaGermanyGhanaGreeceGreenlandGrenadaGuamGuatemalaGuineaGuinea-BissauGuyanaHaitiHeavily indebted poor countries (HIPC)High incomeHondurasHong Kong SAR, ChinaHungaryIBRD onlyIcelandIDA & IBRD totalIDA blendIDA onlyIDA totalIndiaIndonesiaIran, Islamic Rep.IraqIrelandIsle of ManIsraelItalyJamaicaJapanJordanKazakhstanKenyaKiribatiKorea, Dem. People’s Rep.Korea, Rep.KosovoKuwaitKyrgyz RepublicLao PDRLate-demographic dividendLatin America & Caribbean Latin America & Caribbean (excluding high income)Latin America & the Caribbean (IDA & IBRD countries)LatviaLeast developed countries: UN classificationLebanonLesothoLiberiaLibyaLiechtensteinLithuaniaLow & middle incomeLow incomeLower middle incomeLuxembourgMacao SAR, ChinaMacedonia, FYRMadagascarMalawiMalaysiaMaldivesMaliMaltaMarshall IslandsMauritaniaMauritiusMexicoMicronesia, Fed. Sts.Middle East & North AfricaMiddle East & North Africa (excluding high income)Middle East & North Africa (IDA & IBRD countries)Middle incomeMoldovaMonacoMongoliaMontenegroMoroccoMozambiqueMyanmarNamibiaNepalNetherlandsNew CaledoniaNew ZealandNicaraguaNigerNigeriaNorth AmericaNorwayOECD membersOmanOther small statesPacific island small statesPakistanPalauPanamaPapua New GuineaParaguayPeruPhilippinesPolandPortugalPost-demographic dividendPre-demographic dividendPuerto RicoQatarRomaniaRussian FederationRwandaSamoaSan MarinoSao Tome and PrincipeSaudi ArabiaSenegalSerbiaSeychellesSierra LeoneSingaporeSint Maarten (Dutch part)Slovak RepublicSloveniaSmall statesSolomon IslandsSomaliaSouth AfricaSouth AsiaSouth Asia (IDA & IBRD)South SudanSpainSri LankaSt. Kitts and NevisSt. LuciaSt. Martin (French part)St. Vincent and the GrenadinesSub-Saharan Africa Sub-Saharan Africa (excluding high income)Sub-Saharan Africa (IDA & IBRD countries)SudanSurinameSwazilandSwedenSwitzerlandSyrian Arab RepublicTajikistanTanzaniaThailandTimor-LesteTogoTongaTrinidad and TobagoTunisiaTurkeyTurkmenistanUgandaUkraineUnited Arab EmiratesUnited KingdomUnited StatesUpper middle incomeUruguayUzbekistanVanuatuVenezuela, RBVietnamVirgin Islands (U.S.)West Bank and GazaWorldYemen, Rep.ZambiaZimbabwe La ligne de temps
Cette échelle de temps montre un graphique de 1961 année à 2015 année Algeria. Les données jusqu'à 1960 année ne sont pas présentés. Quantité d'observations actuelles selon dates: 55.
Source (désignation):
Les indicateurs du développement mondiale
Source (organisation):
(1) United Nations Population Division. World Population Prospects, (2) Census reports and other statistical publications from national statistical offices, (3) Eurostat: Demographic Statistics, (4) United Nations Statistical Division. Population and Vital Statistics Reprot (various years), (5) U.S. Census Bureau: International Database, and (6) Secretariat of the Pacific Community: Statistics and Demography Programme.
Catégories:
Health
Dernière mise à jour
23 avr. 2017
Les indicateurs de changement de valeurs selon les années
Minimum:
19.275
1 janv. 2002
Maximum:
49.671
1 janv. 1961
Pour la date d''observation
Valeur
Changement absolu
Le changement par rapport à la valeur précédente
1 janv. 1961
49.671
+49.671
0.0%
1 janv. 1962
49.576
-0.095
-0.19%
1 janv. 1963
49.416
-0.16
-0.32%
1 janv. 1964
49.181
-0.235
-0.48%
1 janv. 1965
48.877
-0.304
-0.62%
1 janv. 1966
48.524
-0.353
-0.72%
1 janv. 1967
48.155
-0.369
-0.76%
1 janv. 1968
47.804
-0.351
-0.73%
1 janv. 1969
47.494
-0.31
-0.65%
1 janv. 1970
47.232
-0.262
-0.55%
1 janv. 1971
47.021
-0.211
-0.45%
1 janv. 1972
46.853
-0.168
-0.36%
1 janv. 1973
46.7
-0.153
-0.33%
1 janv. 1974
46.532
-0.168
-0.36%
1 janv. 1975
46.325
-0.207
-0.44%
1 janv. 1976
46.052
-0.273
-0.59%
1 janv. 1977
45.69
-0.362
-0.79%
1 janv. 1978
45.229
-0.461
-1.01%
1 janv. 1979
44.663
-0.566
-1.25%
1 janv. 1980
43.988
-0.675
-1.51%
1 janv. 1981
43.206
-0.782
-1.78%
1 janv. 1982
42.324
-0.882
-2.04%
1 janv. 1983
41.364
-0.96
-2.27%
1 janv. 1984
40.345
-1.019
-2.46%
1 janv. 1985
39.277
-1.068
-2.65%
1 janv. 1986
38.17
-1.107
-2.82%
1 janv. 1987
37.03
-1.14
-2.99%
1 janv. 1988
35.857
-1.173
-3.17%
1 janv. 1989
34.651
-1.206
-3.36%
1 janv. 1990
33.415
-1.236
-3.57%
1 janv. 1991
32.132
-1.283
-3.84%
1 janv. 1992
30.778
-1.354
-4.21%
1 janv. 1993
29.351
-1.427
-4.64%
1 janv. 1994
27.87
-1.481
-5.05%
1 janv. 1995
26.371
-1.499
-5.38%
1 janv. 1996
24.895
-1.476
-5.6%
1 janv. 1997
23.488
-1.407
-5.65%
1 janv. 1998
22.202
-1.286
-5.48%
1 janv. 1999
21.087
-1.115
-5.02%
1 janv. 2000
20.19
-0.897
-4.25%
1 janv. 2001
19.57
-0.62
-3.07%
1 janv. 2002
19.275
-0.295
-1.51%
1 janv. 2003
19.293
+0.018
0.09%
1 janv. 2004
19.586
+0.293
1.52%
1 janv. 2005
20.113
+0.527
2.69%
1 janv. 2006
20.823
+0.71
3.53%
1 janv. 2007
21.659
+0.836
4.01%
1 janv. 2008
22.541
+0.882
4.07%
1 janv. 2009
23.382
+0.841
3.73%
1 janv. 2010
24.11
+0.728
3.11%
1 janv. 2011
24.643
+0.533
2.21%
1 janv. 2012
24.921
+0.278
1.13%
1 janv. 2013
24.946
+0.025
0.1%
1 janv. 2014
24.738
-0.208
-0.83%
1 janv. 2015
24.309
-0.429
-1.73%
Classement des pays selon les statistiques actuelles par années


Commentaires: