29
/fr/
fr
AIzaSyAYiBZKx7MnpbEhh9jyipgxe19OcubqV5w
April 1, 2024
279536
Vanuatu
VUT
true
2
1
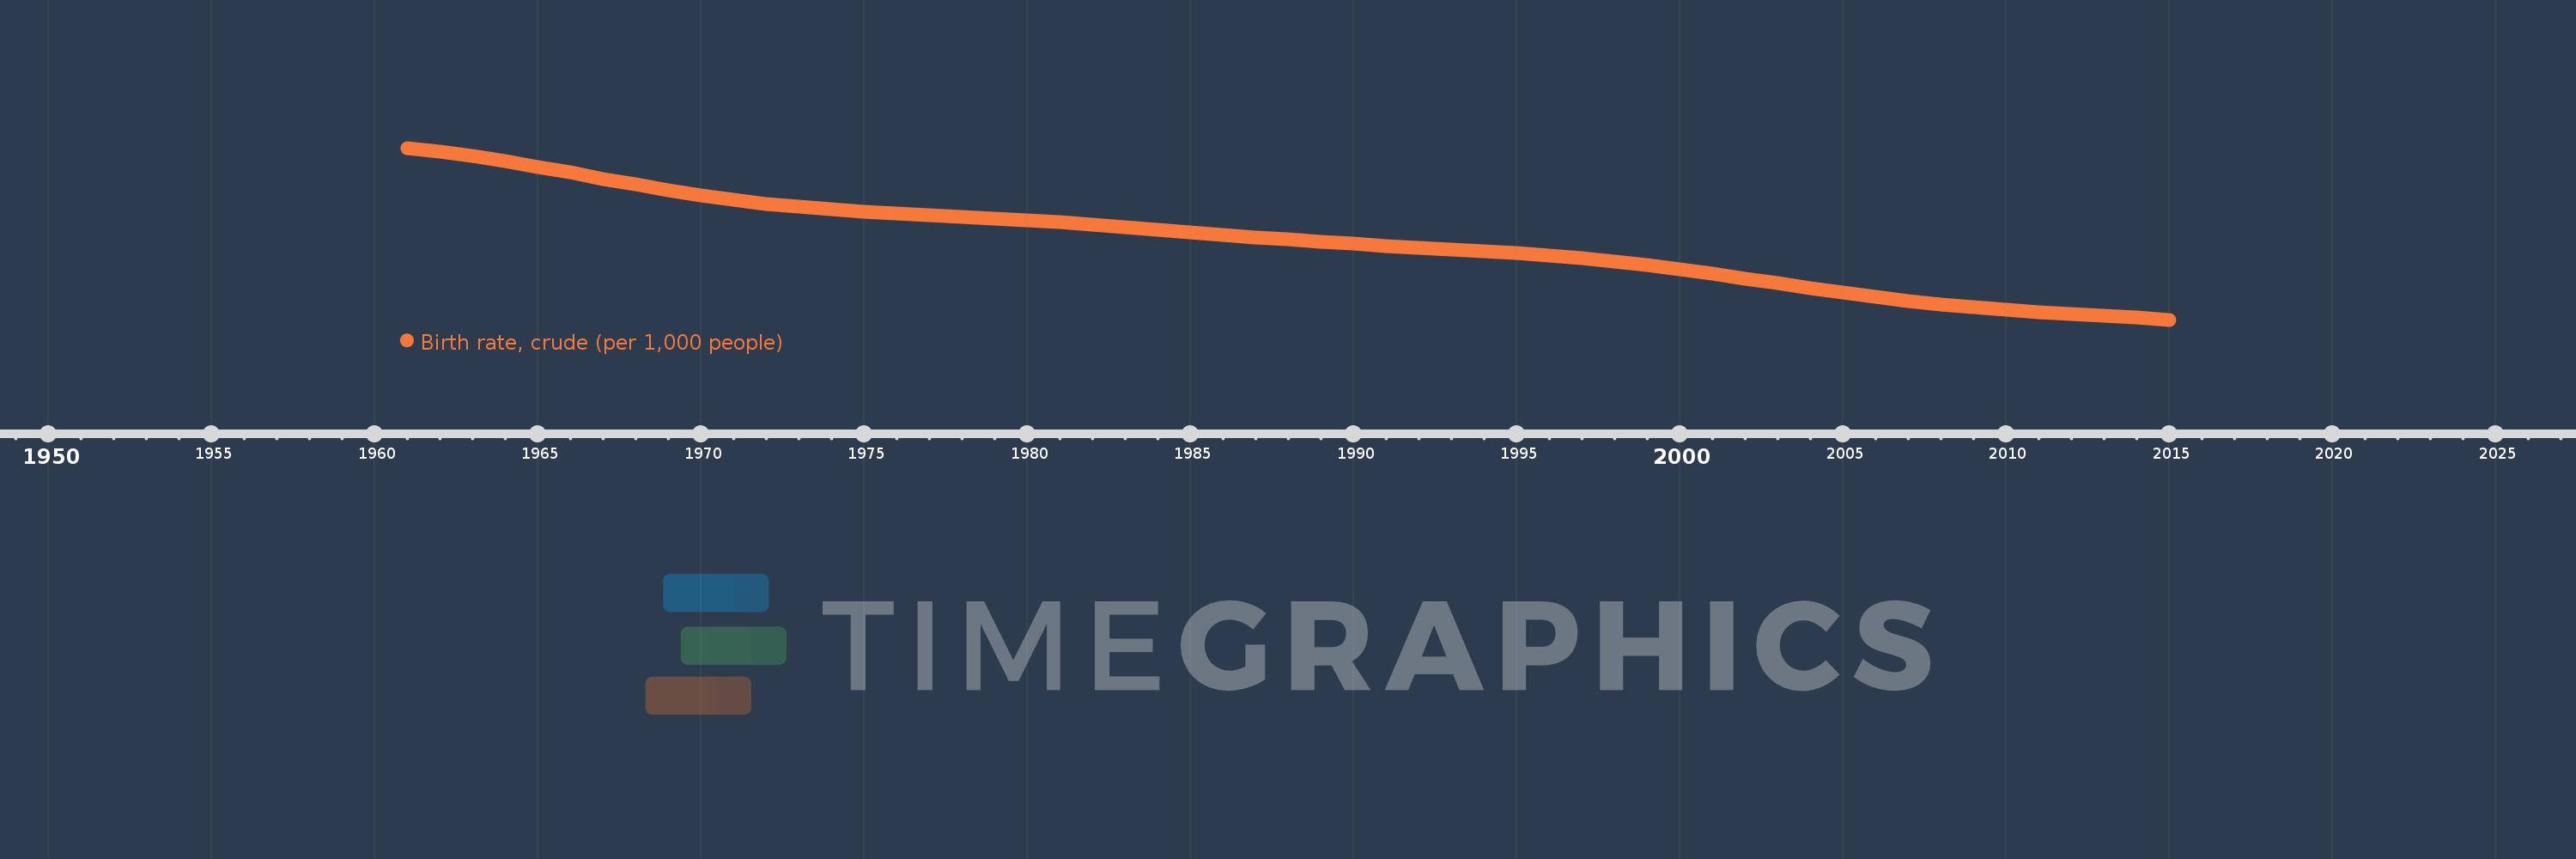
Birth rate, crude (per 1,000 people)
2015,2014,2013,2012,2011,2010,2009,2008,2007,2006,2005,2004,2003,2002,2001,2000,1999,1998,1997,1996,1995,1994,1993,1992,1991,1990,1989,1988,1987,1986,1985,1984,1983,1982,1981,1980,1979,1978,1977,1976,1975,1974,1973,1972,1971,1970,1969,1968,1967,1966,1965,1964,1963,1962,1961
Cette statistique dans les autres pays:
AfghanistanAlbaniaAlgeriaAmerican SamoaAndorraAngolaAntigua and BarbudaArab WorldArgentinaArmeniaArubaAustraliaAustriaAzerbaijanBahamas, TheBahrainBangladeshBarbadosBelarusBelgiumBelizeBeninBermudaBhutanBoliviaBosnia and HerzegovinaBotswanaBrazilBrunei DarussalamBulgariaBurkina FasoBurundiCabo VerdeCambodiaCameroonCanadaCaribbean small statesCayman IslandsCentral African RepublicCentral Europe and the BalticsChadChannel IslandsChileChinaColombiaComorosCongo, Dem. Rep.Congo, Rep.Costa RicaCote d'IvoireCroatiaCubaCuracaoCyprusCzech RepublicDenmarkDjiboutiDominicaDominican RepublicEarly-demographic dividendEast Asia & PacificEast Asia & Pacific (excluding high income)East Asia & Pacific (IDA & IBRD countries)EcuadorEgypt, Arab Rep.El SalvadorEquatorial GuineaEritreaEstoniaEthiopiaEuro areaEurope & Central AsiaEurope & Central Asia (excluding high income)Europe & Central Asia (IDA & IBRD countries)European UnionFaroe IslandsFijiFinlandFragile and conflict affected situationsFranceFrench PolynesiaGabonGambia, TheGeorgiaGermanyGhanaGreeceGreenlandGrenadaGuamGuatemalaGuineaGuinea-BissauGuyanaHaitiHeavily indebted poor countries (HIPC)High incomeHondurasHong Kong SAR, ChinaHungaryIBRD onlyIcelandIDA & IBRD totalIDA blendIDA onlyIDA totalIndiaIndonesiaIran, Islamic Rep.IraqIrelandIsle of ManIsraelItalyJamaicaJapanJordanKazakhstanKenyaKiribatiKorea, Dem. People’s Rep.Korea, Rep.KosovoKuwaitKyrgyz RepublicLao PDRLate-demographic dividendLatin America & Caribbean Latin America & Caribbean (excluding high income)Latin America & the Caribbean (IDA & IBRD countries)LatviaLeast developed countries: UN classificationLebanonLesothoLiberiaLibyaLiechtensteinLithuaniaLow & middle incomeLow incomeLower middle incomeLuxembourgMacao SAR, ChinaMacedonia, FYRMadagascarMalawiMalaysiaMaldivesMaliMaltaMarshall IslandsMauritaniaMauritiusMexicoMicronesia, Fed. Sts.Middle East & North AfricaMiddle East & North Africa (excluding high income)Middle East & North Africa (IDA & IBRD countries)Middle incomeMoldovaMonacoMongoliaMontenegroMoroccoMozambiqueMyanmarNamibiaNepalNetherlandsNew CaledoniaNew ZealandNicaraguaNigerNigeriaNorth AmericaNorwayOECD membersOmanOther small statesPacific island small statesPakistanPalauPanamaPapua New GuineaParaguayPeruPhilippinesPolandPortugalPost-demographic dividendPre-demographic dividendPuerto RicoQatarRomaniaRussian FederationRwandaSamoaSan MarinoSao Tome and PrincipeSaudi ArabiaSenegalSerbiaSeychellesSierra LeoneSingaporeSint Maarten (Dutch part)Slovak RepublicSloveniaSmall statesSolomon IslandsSomaliaSouth AfricaSouth AsiaSouth Asia (IDA & IBRD)South SudanSpainSri LankaSt. Kitts and NevisSt. LuciaSt. Martin (French part)St. Vincent and the GrenadinesSub-Saharan Africa Sub-Saharan Africa (excluding high income)Sub-Saharan Africa (IDA & IBRD countries)SudanSurinameSwazilandSwedenSwitzerlandSyrian Arab RepublicTajikistanTanzaniaThailandTimor-LesteTogoTongaTrinidad and TobagoTunisiaTurkeyTurkmenistanUgandaUkraineUnited Arab EmiratesUnited KingdomUnited StatesUpper middle incomeUruguayUzbekistanVanuatuVenezuela, RBVietnamVirgin Islands (U.S.)West Bank and GazaWorldYemen, Rep.ZambiaZimbabwe La ligne de temps
Cette échelle de temps montre un graphique de 1961 année à 2015 année Vanuatu. Les données jusqu'à 1960 année ne sont pas présentés. Quantité d'observations actuelles selon dates: 55.
Source (désignation):
Les indicateurs du développement mondiale
Source (organisation):
(1) United Nations Population Division. World Population Prospects, (2) Census reports and other statistical publications from national statistical offices, (3) Eurostat: Demographic Statistics, (4) United Nations Statistical Division. Population and Vital Statistics Reprot (various years), (5) U.S. Census Bureau: International Database, and (6) Secretariat of the Pacific Community: Statistics and Demography Programme.
Catégories:
Health
Dernière mise à jour
23 avr. 2017
Les indicateurs de changement de valeurs selon les années
Minimum:
26.466
1 janv. 2015
Maximum:
48.783
1 janv. 1961
Pour la date d''observation
Valeur
Changement absolu
Le changement par rapport à la valeur précédente
1 janv. 1961
48.783
+48.783
0.0%
1 janv. 1962
48.29
-0.493
-1.01%
1 janv. 1963
47.716
-0.574
-1.19%
1 janv. 1964
47.061
-0.655
-1.37%
1 janv. 1965
46.339
-0.722
-1.53%
1 janv. 1966
45.57
-0.769
-1.66%
1 janv. 1967
44.782
-0.788
-1.73%
1 janv. 1968
44.009
-0.773
-1.73%
1 janv. 1969
43.28
-0.729
-1.66%
1 janv. 1970
42.616
-0.664
-1.53%
1 janv. 1971
42.035
-0.581
-1.36%
1 janv. 1972
41.548
-0.487
-1.16%
1 janv. 1973
41.142
-0.406
-0.98%
1 janv. 1974
40.801
-0.341
-0.83%
1 janv. 1975
40.514
-0.287
-0.7%
1 janv. 1976
40.269
-0.245
-0.6%
1 janv. 1977
40.047
-0.222
-0.55%
1 janv. 1978
39.834
-0.213
-0.53%
1 janv. 1979
39.613
-0.221
-0.55%
1 janv. 1980
39.374
-0.239
-0.6%
1 janv. 1981
39.108
-0.266
-0.68%
1 janv. 1982
38.812
-0.296
-0.76%
1 janv. 1983
38.495
-0.317
-0.82%
1 janv. 1984
38.166
-0.329
-0.85%
1 janv. 1985
37.829
-0.337
-0.88%
1 janv. 1986
37.494
-0.335
-0.89%
1 janv. 1987
37.171
-0.323
-0.86%
1 janv. 1988
36.868
-0.303
-0.82%
1 janv. 1989
36.585
-0.283
-0.77%
1 janv. 1990
36.322
-0.263
-0.72%
1 janv. 1991
36.076
-0.246
-0.68%
1 janv. 1992
35.842
-0.234
-0.65%
1 janv. 1993
35.609
-0.233
-0.65%
1 janv. 1994
35.362
-0.247
-0.69%
1 janv. 1995
35.092
-0.27
-0.76%
1 janv. 1996
34.783
-0.309
-0.88%
1 janv. 1997
34.42
-0.363
-1.04%
1 janv. 1998
34.002
-0.418
-1.21%
1 janv. 1999
33.53
-0.472
-1.39%
1 janv. 2000
33.009
-0.521
-1.55%
1 janv. 2001
32.443
-0.566
-1.71%
1 janv. 2002
31.84
-0.603
-1.86%
1 janv. 2003
31.219
-0.621
-1.95%
1 janv. 2004
30.597
-0.622
-1.99%
1 janv. 2005
29.993
-0.604
-1.97%
1 janv. 2006
29.427
-0.566
-1.89%
1 janv. 2007
28.92
-0.507
-1.72%
1 janv. 2008
28.475
-0.445
-1.54%
1 janv. 2009
28.091
-0.384
-1.35%
1 janv. 2010
27.766
-0.325
-1.16%
1 janv. 2011
27.486
-0.28
-1.01%
1 janv. 2012
27.236
-0.25
-0.91%
1 janv. 2013
26.993
-0.243
-0.89%
1 janv. 2014
26.739
-0.254
-0.94%
1 janv. 2015
26.466
-0.273
-1.02%
Classement des pays selon les statistiques actuelles par années


Commentaires: