29
/fr/
fr
AIzaSyAYiBZKx7MnpbEhh9jyipgxe19OcubqV5w
April 1, 2024
65031
Albania
ALB
true
2
1
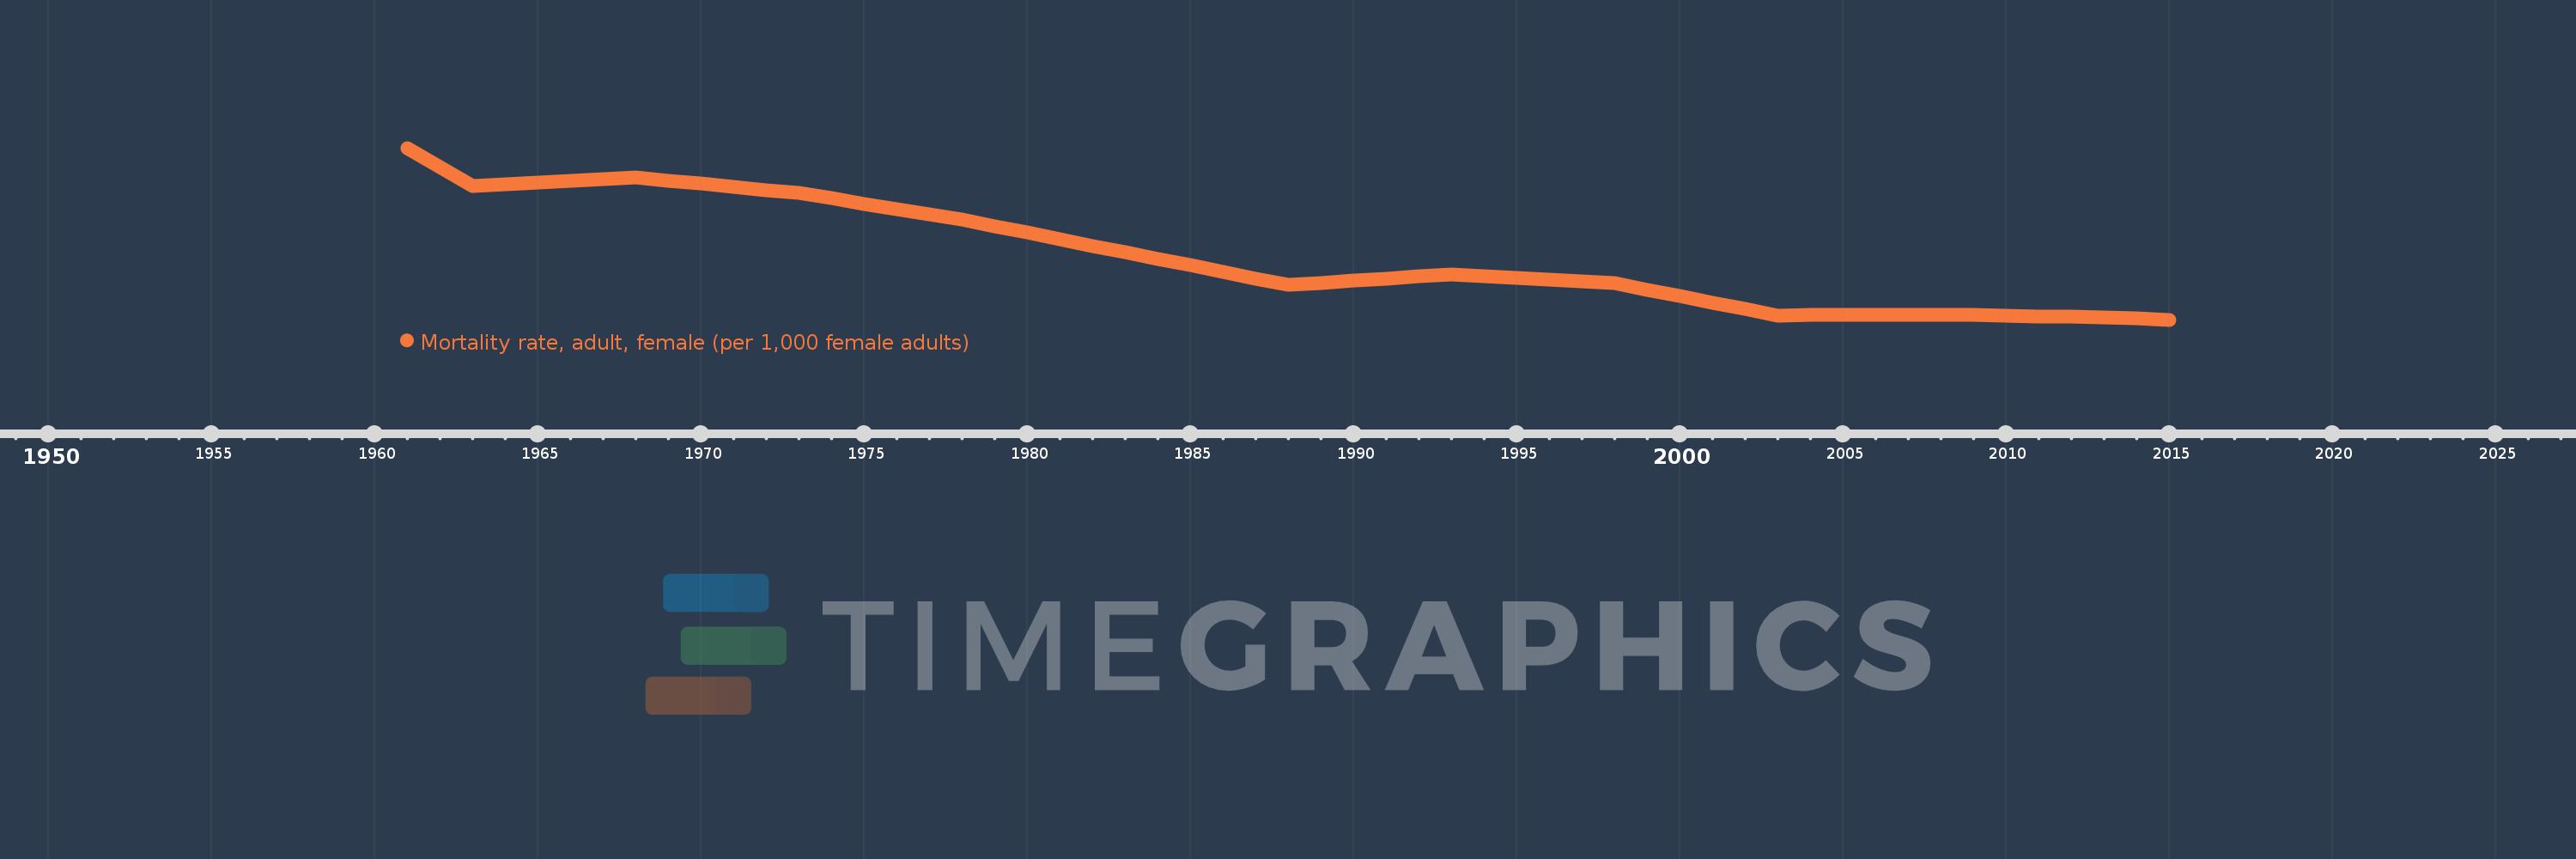
Mortality rate, adult, female (per 1,000 female adults)
2015,2014,2013,2012,2011,2010,2009,2008,2007,2006,2005,2004,2003,2002,2001,2000,1999,1998,1997,1996,1995,1994,1993,1992,1991,1990,1989,1988,1987,1986,1985,1984,1983,1982,1981,1980,1979,1978,1977,1976,1975,1974,1973,1972,1971,1970,1969,1968,1967,1966,1965,1964,1963,1962,1961
Cette statistique dans les autres pays:
AfghanistanAlbaniaAlgeriaAngolaAntigua and BarbudaArab WorldArgentinaArmeniaArubaAustraliaAustriaAzerbaijanBahamas, TheBahrainBangladeshBarbadosBelarusBelgiumBelizeBeninBhutanBoliviaBosnia and HerzegovinaBotswanaBrazilBrunei DarussalamBulgariaBurkina FasoBurundiCabo VerdeCambodiaCameroonCanadaCaribbean small statesCentral African RepublicCentral Europe and the BalticsChadChannel IslandsChileChinaColombiaComorosCongo, Dem. Rep.Congo, Rep.Costa RicaCote d'IvoireCroatiaCubaCuracaoCyprusCzech RepublicDenmarkDjiboutiDominicaDominican RepublicEarly-demographic dividendEast Asia & PacificEast Asia & Pacific (excluding high income)East Asia & Pacific (IDA & IBRD countries)EcuadorEgypt, Arab Rep.El SalvadorEquatorial GuineaEritreaEstoniaEthiopiaEuro areaEurope & Central AsiaEurope & Central Asia (excluding high income)Europe & Central Asia (IDA & IBRD countries)European UnionFijiFinlandFragile and conflict affected situationsFranceFrench PolynesiaGabonGambia, TheGeorgiaGermanyGhanaGreeceGreenlandGrenadaGuamGuatemalaGuineaGuinea-BissauGuyanaHaitiHeavily indebted poor countries (HIPC)High incomeHondurasHong Kong SAR, ChinaHungaryIBRD onlyIcelandIDA & IBRD totalIDA blendIDA onlyIDA totalIndiaIndonesiaIran, Islamic Rep.IraqIrelandIsraelItalyJamaicaJapanJordanKazakhstanKenyaKiribatiKorea, Dem. People’s Rep.Korea, Rep.KuwaitKyrgyz RepublicLao PDRLate-demographic dividendLatin America & Caribbean Latin America & Caribbean (excluding high income)Latin America & the Caribbean (IDA & IBRD countries)LatviaLeast developed countries: UN classificationLebanonLesothoLiberiaLibyaLithuaniaLow & middle incomeLow incomeLower middle incomeLuxembourgMacao SAR, ChinaMacedonia, FYRMadagascarMalawiMalaysiaMaldivesMaliMaltaMarshall IslandsMauritaniaMauritiusMexicoMicronesia, Fed. Sts.Middle East & North AfricaMiddle East & North Africa (excluding high income)Middle East & North Africa (IDA & IBRD countries)Middle incomeMoldovaMongoliaMontenegroMoroccoMozambiqueMyanmarNamibiaNepalNetherlandsNew CaledoniaNew ZealandNicaraguaNigerNigeriaNorth AmericaNorwayOECD membersOmanOther small statesPacific island small statesPakistanPanamaPapua New GuineaParaguayPeruPhilippinesPolandPortugalPost-demographic dividendPre-demographic dividendPuerto RicoQatarRomaniaRussian FederationRwandaSamoaSao Tome and PrincipeSaudi ArabiaSenegalSerbiaSeychellesSierra LeoneSingaporeSlovak RepublicSloveniaSmall statesSolomon IslandsSomaliaSouth AfricaSouth AsiaSouth Asia (IDA & IBRD)South SudanSpainSri LankaSt. Kitts and NevisSt. LuciaSt. Vincent and the GrenadinesSub-Saharan Africa Sub-Saharan Africa (excluding high income)Sub-Saharan Africa (IDA & IBRD countries)SudanSurinameSwazilandSwedenSwitzerlandSyrian Arab RepublicTajikistanTanzaniaThailandTimor-LesteTogoTongaTrinidad and TobagoTunisiaTurkeyTurkmenistanUgandaUkraineUnited Arab EmiratesUnited KingdomUnited StatesUpper middle incomeUruguayUzbekistanVanuatuVenezuela, RBVietnamVirgin Islands (U.S.)West Bank and GazaWorldYemen, Rep.ZambiaZimbabwe La ligne de temps
Cette échelle de temps montre un graphique de 1961 année à 2015 année Albania. Les données jusqu'à 1960 année ne sont pas présentés. Quantité d'observations actuelles selon dates: 55.
Source (désignation):
Les indicateurs du développement mondiale
Source (organisation):
(1) United Nations Population Division. World Population Prospects. New York, United Nations, Department of Economic and Social Affairs (advanced Excel tables). Available at http://esa.un.org/wpp/unpp/panel_population.htm, (2) University of California, Berkeley, and Max Planck Institute for Demographic Research. Human Mortality Database. [ www.mortality.org or www.humanmortality.de].
Catégories:
Health, Gender
Dernière mise à jour
23 avr. 2017
Les indicateurs de changement de valeurs selon les années
Minimum:
50.325
1 janv. 2015
Maximum:
151.058
1 janv. 1961
Pour la date d''observation
Valeur
Changement absolu
Le changement par rapport à la valeur précédente
1 janv. 1961
151.058
+151.058
0.0%
1 janv. 1962
139.856
-11.202
-7.42%
1 janv. 1963
128.654
-11.202
-8.01%
1 janv. 1964
129.676
+1.022
0.79%
1 janv. 1965
130.698
+1.022
0.79%
1 janv. 1966
131.72
+1.022
0.78%
1 janv. 1967
132.743
+1.023
0.78%
1 janv. 1968
133.765
+1.022
0.77%
1 janv. 1969
131.93
-1.835
-1.37%
1 janv. 1970
130.095
-1.835
-1.39%
1 janv. 1971
128.26
-1.835
-1.41%
1 janv. 1972
126.425
-1.835
-1.43%
1 janv. 1973
124.59
-1.835
-1.45%
1 janv. 1974
121.461
-3.129
-2.51%
1 janv. 1975
118.332
-3.129
-2.58%
1 janv. 1976
115.203
-3.129
-2.64%
1 janv. 1977
112.075
-3.128
-2.72%
1 janv. 1978
108.946
-3.129
-2.79%
1 janv. 1979
105.126
-3.82
-3.51%
1 janv. 1980
101.307
-3.819
-3.63%
1 janv. 1981
97.488
-3.819
-3.77%
1 janv. 1982
93.668
-3.82
-3.92%
1 janv. 1983
89.849
-3.819
-4.08%
1 janv. 1984
86.023
-3.826
-4.26%
1 janv. 1985
82.196
-3.827
-4.45%
1 janv. 1986
78.37
-3.826
-4.65%
1 janv. 1987
74.543
-3.827
-4.88%
1 janv. 1988
70.717
-3.826
-5.13%
1 janv. 1989
71.986
+1.269
1.79%
1 janv. 1990
73.255
+1.269
1.76%
1 janv. 1991
74.524
+1.269
1.73%
1 janv. 1992
75.793
+1.269
1.7%
1 janv. 1993
77.062
+1.269
1.67%
1 janv. 1994
76.007
-1.055
-1.37%
1 janv. 1995
74.951
-1.056
-1.39%
1 janv. 1996
73.895
-1.056
-1.41%
1 janv. 1997
72.839
-1.056
-1.43%
1 janv. 1998
71.783
-1.056
-1.45%
1 janv. 1999
68.008
-3.775
-5.26%
1 janv. 2000
64.234
-3.774
-5.55%
1 janv. 2001
60.459
-3.775
-5.88%
1 janv. 2002
56.684
-3.775
-6.24%
1 janv. 2003
52.909
-3.775
-6.66%
1 janv. 2004
52.987
+0.078
0.15%
1 janv. 2005
53.066
+0.079
0.15%
1 janv. 2006
53.145
+0.079
0.15%
1 janv. 2007
53.224
+0.079
0.15%
1 janv. 2008
53.303
+0.079
0.15%
1 janv. 2009
52.962
-0.341
-0.64%
1 janv. 2010
52.622
-0.34
-0.64%
1 janv. 2011
52.281
-0.341
-0.65%
1 janv. 2012
51.941
-0.34
-0.65%
1 janv. 2013
51.6
-0.341
-0.66%
1 janv. 2014
50.963
-0.637
-1.23%
1 janv. 2015
50.325
-0.638
-1.25%
Classement des pays selon les statistiques actuelles par années


Commentaires: