29
/fr/
fr
AIzaSyAYiBZKx7MnpbEhh9jyipgxe19OcubqV5w
April 1, 2024
39220
IDA only
IDX
false
2
1
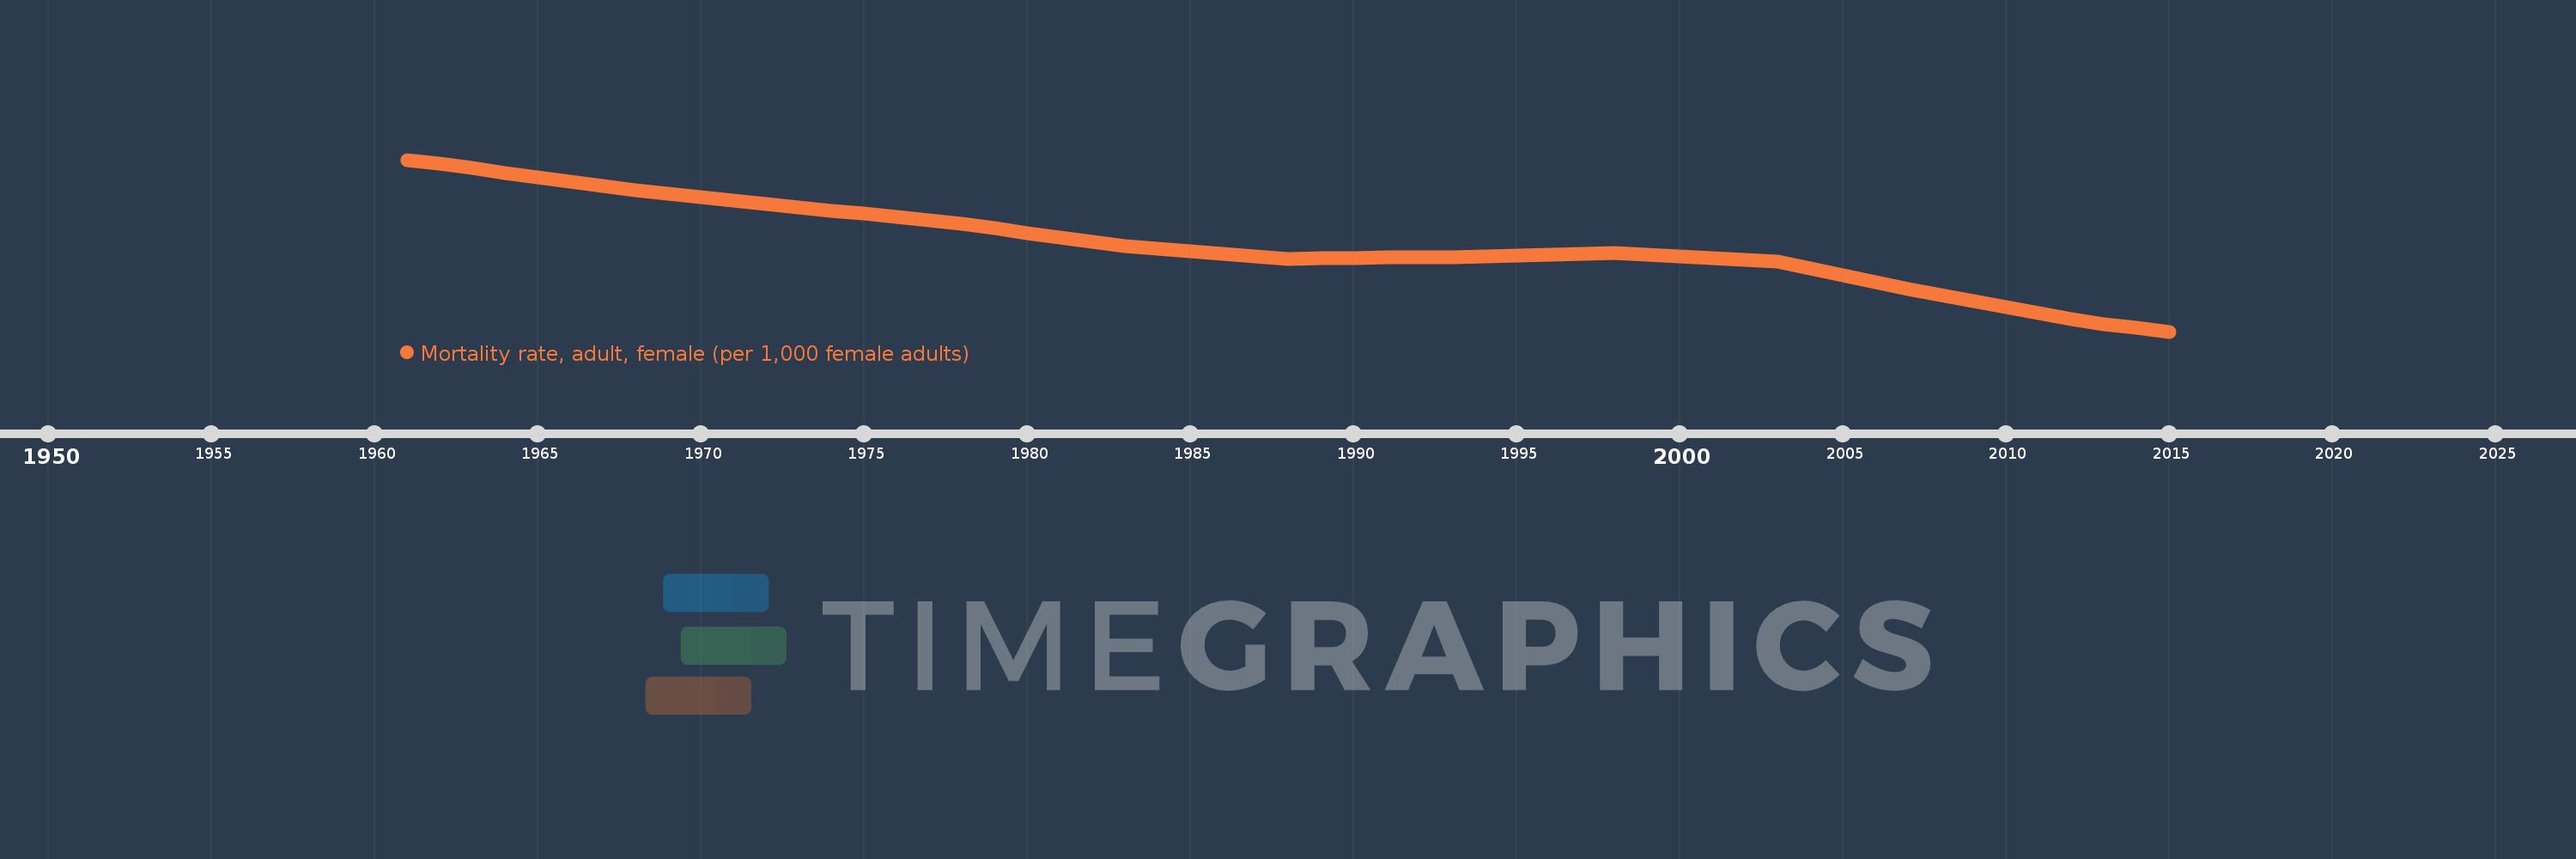
Mortality rate, adult, female (per 1,000 female adults)
2015,2014,2013,2012,2011,2010,2009,2008,2007,2006,2005,2004,2003,2002,2001,2000,1999,1998,1997,1996,1995,1994,1993,1992,1991,1990,1989,1988,1987,1986,1985,1984,1983,1982,1981,1980,1979,1978,1977,1976,1975,1974,1973,1972,1971,1970,1969,1968,1967,1966,1965,1964,1963,1962,1961
Cette statistique dans les autres pays:
AfghanistanAlbaniaAlgeriaAngolaAntigua and BarbudaArab WorldArgentinaArmeniaArubaAustraliaAustriaAzerbaijanBahamas, TheBahrainBangladeshBarbadosBelarusBelgiumBelizeBeninBhutanBoliviaBosnia and HerzegovinaBotswanaBrazilBrunei DarussalamBulgariaBurkina FasoBurundiCabo VerdeCambodiaCameroonCanadaCaribbean small statesCentral African RepublicCentral Europe and the BalticsChadChannel IslandsChileChinaColombiaComorosCongo, Dem. Rep.Congo, Rep.Costa RicaCote d'IvoireCroatiaCubaCuracaoCyprusCzech RepublicDenmarkDjiboutiDominicaDominican RepublicEarly-demographic dividendEast Asia & PacificEast Asia & Pacific (excluding high income)East Asia & Pacific (IDA & IBRD countries)EcuadorEgypt, Arab Rep.El SalvadorEquatorial GuineaEritreaEstoniaEthiopiaEuro areaEurope & Central AsiaEurope & Central Asia (excluding high income)Europe & Central Asia (IDA & IBRD countries)European UnionFijiFinlandFragile and conflict affected situationsFranceFrench PolynesiaGabonGambia, TheGeorgiaGermanyGhanaGreeceGreenlandGrenadaGuamGuatemalaGuineaGuinea-BissauGuyanaHaitiHeavily indebted poor countries (HIPC)High incomeHondurasHong Kong SAR, ChinaHungaryIBRD onlyIcelandIDA & IBRD totalIDA blendIDA onlyIDA totalIndiaIndonesiaIran, Islamic Rep.IraqIrelandIsraelItalyJamaicaJapanJordanKazakhstanKenyaKiribatiKorea, Dem. People’s Rep.Korea, Rep.KuwaitKyrgyz RepublicLao PDRLate-demographic dividendLatin America & Caribbean Latin America & Caribbean (excluding high income)Latin America & the Caribbean (IDA & IBRD countries)LatviaLeast developed countries: UN classificationLebanonLesothoLiberiaLibyaLithuaniaLow & middle incomeLow incomeLower middle incomeLuxembourgMacao SAR, ChinaMacedonia, FYRMadagascarMalawiMalaysiaMaldivesMaliMaltaMarshall IslandsMauritaniaMauritiusMexicoMicronesia, Fed. Sts.Middle East & North AfricaMiddle East & North Africa (excluding high income)Middle East & North Africa (IDA & IBRD countries)Middle incomeMoldovaMongoliaMontenegroMoroccoMozambiqueMyanmarNamibiaNepalNetherlandsNew CaledoniaNew ZealandNicaraguaNigerNigeriaNorth AmericaNorwayOECD membersOmanOther small statesPacific island small statesPakistanPanamaPapua New GuineaParaguayPeruPhilippinesPolandPortugalPost-demographic dividendPre-demographic dividendPuerto RicoQatarRomaniaRussian FederationRwandaSamoaSao Tome and PrincipeSaudi ArabiaSenegalSerbiaSeychellesSierra LeoneSingaporeSlovak RepublicSloveniaSmall statesSolomon IslandsSomaliaSouth AfricaSouth AsiaSouth Asia (IDA & IBRD)South SudanSpainSri LankaSt. Kitts and NevisSt. LuciaSt. Vincent and the GrenadinesSub-Saharan Africa Sub-Saharan Africa (excluding high income)Sub-Saharan Africa (IDA & IBRD countries)SudanSurinameSwazilandSwedenSwitzerlandSyrian Arab RepublicTajikistanTanzaniaThailandTimor-LesteTogoTongaTrinidad and TobagoTunisiaTurkeyTurkmenistanUgandaUkraineUnited Arab EmiratesUnited KingdomUnited StatesUpper middle incomeUruguayUzbekistanVanuatuVenezuela, RBVietnamVirgin Islands (U.S.)West Bank and GazaWorldYemen, Rep.ZambiaZimbabwe La ligne de temps
Cette échelle de temps montre un graphique de 1961 année à 2015 année IDA only. Les données jusqu'à 1960 année ne sont pas présentés. Quantité d'observations actuelles selon dates: 55.
Source (désignation):
Les indicateurs du développement mondiale
Source (organisation):
(1) United Nations Population Division. World Population Prospects. New York, United Nations, Department of Economic and Social Affairs (advanced Excel tables). Available at http://esa.un.org/wpp/unpp/panel_population.htm, (2) University of California, Berkeley, and Max Planck Institute for Demographic Research. Human Mortality Database. [ www.mortality.org or www.humanmortality.de].
Catégories:
Health, Gender
Dernière mise à jour
23 avr. 2017
Les indicateurs de changement de valeurs selon les années
Minimum:
205.734
1 janv. 2015
Maximum:
403.23
1 janv. 1961
Pour la date d''observation
Valeur
Changement absolu
Le changement par rapport à la valeur précédente
1 janv. 1961
403.23
+403.23
0.0%
1 janv. 1962
398.349
-4.882
-1.21%
1 janv. 1963
393.46
-4.889
-1.23%
1 janv. 1964
388.374
-5.085
-1.29%
1 janv. 1965
383.313
-5.061
-1.3%
1 janv. 1966
378.277
-5.036
-1.31%
1 janv. 1967
373.169
-5.108
-1.35%
1 janv. 1968
368.08
-5.089
-1.36%
1 janv. 1969
364.027
-4.053
-1.1%
1 janv. 1970
360.017
-4.01
-1.1%
1 janv. 1971
356.05
-3.967
-1.1%
1 janv. 1972
352.092
-3.957
-1.11%
1 janv. 1973
348.197
-3.895
-1.11%
1 janv. 1974
344.714
-3.482
-1.0%
1 janv. 1975
341.203
-3.512
-1.02%
1 janv. 1976
337.617
-3.586
-1.05%
1 janv. 1977
333.803
-3.814
-1.13%
1 janv. 1978
329.858
-3.945
-1.18%
1 janv. 1979
324.523
-5.335
-1.62%
1 janv. 1980
319.252
-5.271
-1.62%
1 janv. 1981
314.055
-5.198
-1.63%
1 janv. 1982
308.911
-5.144
-1.64%
1 janv. 1983
303.772
-5.139
-1.66%
1 janv. 1984
300.789
-2.983
-0.98%
1 janv. 1985
297.877
-2.912
-0.97%
1 janv. 1986
295.048
-2.829
-0.95%
1 janv. 1987
292.216
-2.831
-0.96%
1 janv. 1988
289.489
-2.727
-0.93%
1 janv. 1989
289.833
+0.344
0.12%
1 janv. 1990
290.247
+0.414
0.14%
1 janv. 1991
290.678
+0.431
0.15%
1 janv. 1992
290.949
+0.271
0.09%
1 janv. 1993
291.135
+0.185
0.06%
1 janv. 1994
292.046
+0.912
0.31%
1 janv. 1995
293.111
+1.065
0.36%
1 janv. 1996
294.286
+1.175
0.4%
1 janv. 1997
295.412
+1.126
0.38%
1 janv. 1998
296.57
+1.158
0.39%
1 janv. 1999
294.341
-2.229
-0.75%
1 janv. 2000
292.161
-2.181
-0.74%
1 janv. 2001
290.039
-2.122
-0.73%
1 janv. 2002
287.927
-2.112
-0.73%
1 janv. 2003
285.876
-2.051
-0.71%
1 janv. 2004
278.142
-7.734
-2.71%
1 janv. 2005
270.433
-7.709
-2.77%
1 janv. 2006
262.738
-7.695
-2.85%
1 janv. 2007
254.987
-7.751
-2.95%
1 janv. 2008
247.248
-7.739
-3.03%
1 janv. 2009
240.476
-6.772
-2.74%
1 janv. 2010
233.749
-6.727
-2.8%
1 janv. 2011
227.062
-6.687
-2.86%
1 janv. 2012
220.434
-6.628
-2.92%
1 janv. 2013
213.816
-6.618
-3.0%
1 janv. 2014
209.794
-4.022
-1.88%
1 janv. 2015
205.734
-4.059
-1.93%
Classement des pays selon les statistiques actuelles par années


Commentaires: