29
/fr/
fr
AIzaSyAYiBZKx7MnpbEhh9jyipgxe19OcubqV5w
April 1, 2024
61165
Sub-Saharan Africa (IDA & IBRD countries)
TSS
false
2
1
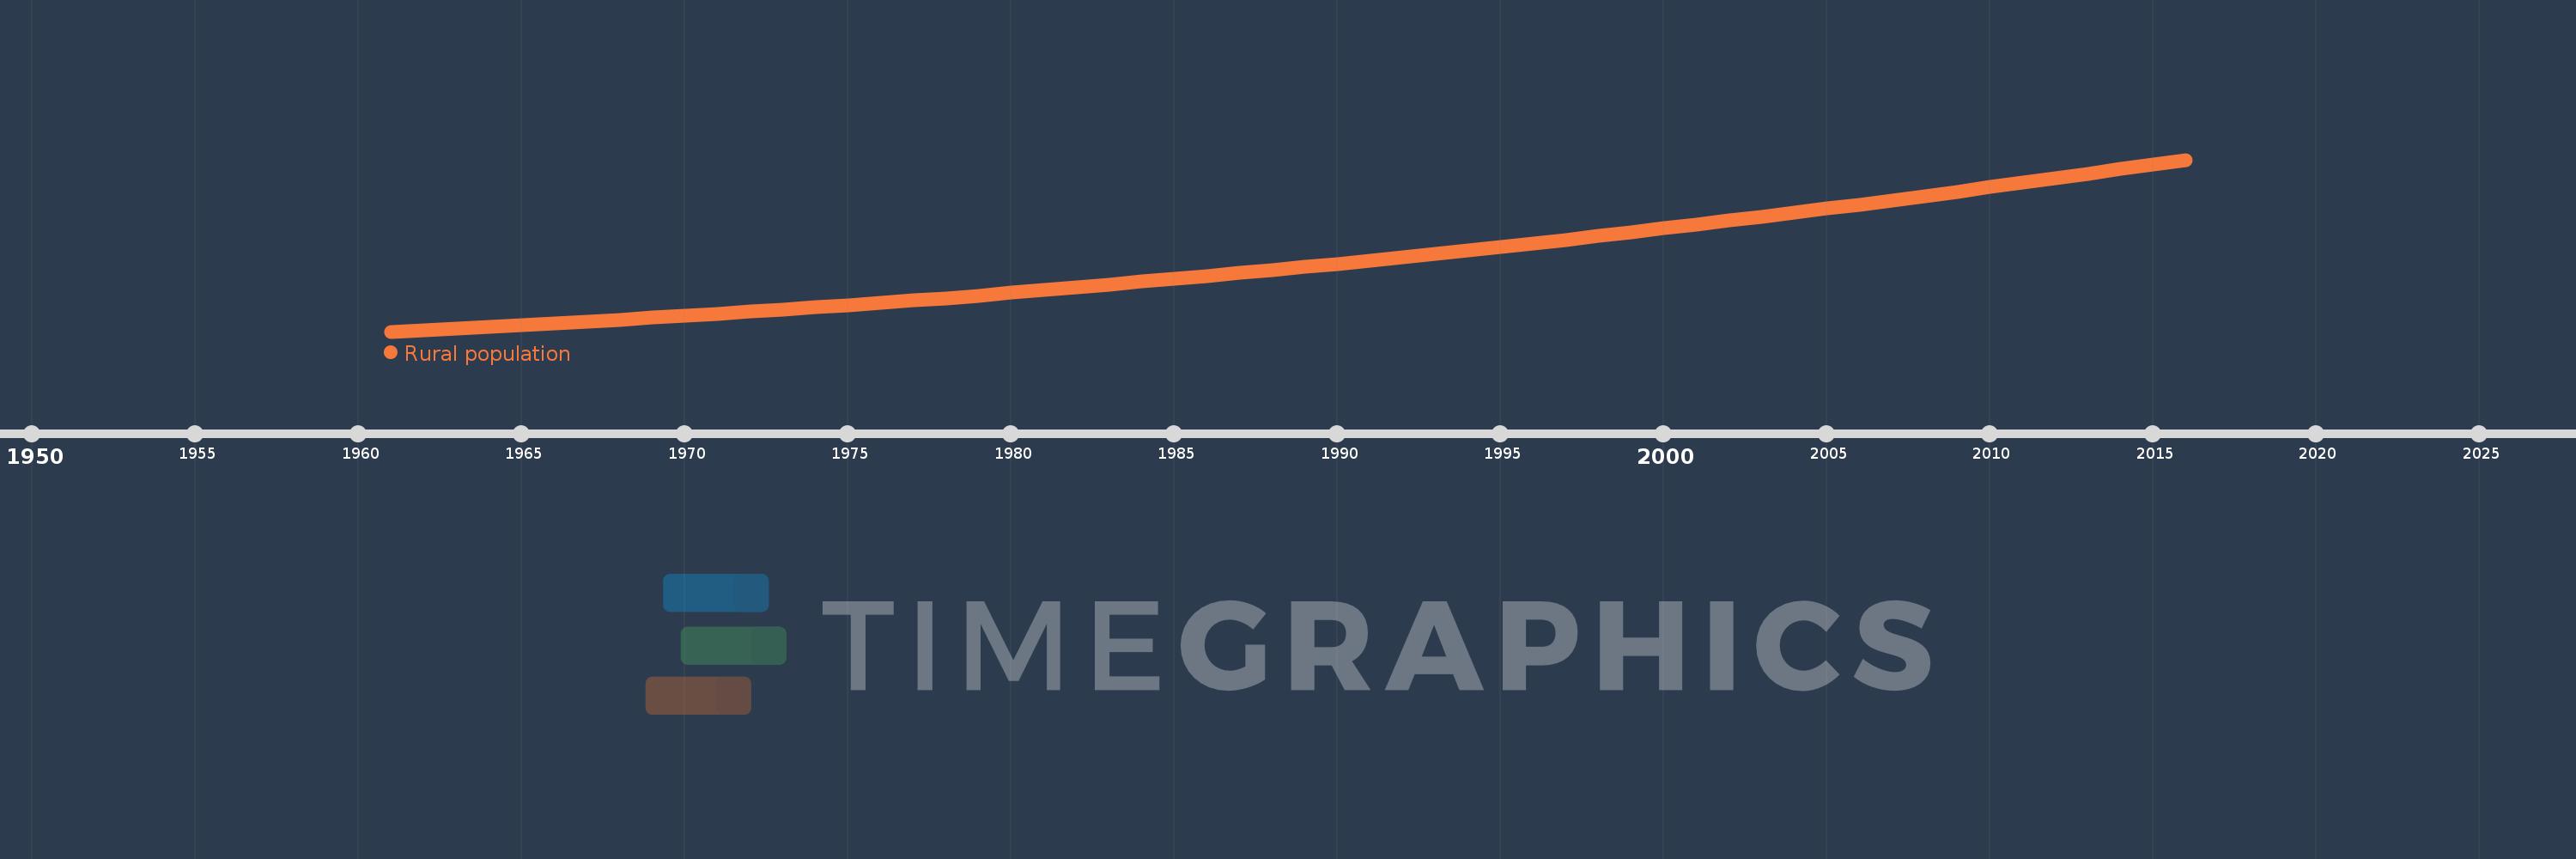
Rural population
2016,2015,2014,2013,2012,2011,2010,2009,2008,2007,2006,2005,2004,2003,2002,2001,2000,1999,1998,1997,1996,1995,1994,1993,1992,1991,1990,1989,1988,1987,1986,1985,1984,1983,1982,1981,1980,1979,1978,1977,1976,1975,1974,1973,1972,1971,1970,1969,1968,1967,1966,1965,1964,1963,1962,1961
Cette statistique dans les autres pays:
AfghanistanAlbaniaAlgeriaAmerican SamoaAndorraAngolaAntigua and BarbudaArab WorldArgentinaArmeniaArubaAustraliaAustriaAzerbaijanBahamas, TheBahrainBangladeshBarbadosBelarusBelgiumBelizeBeninBermudaBhutanBoliviaBosnia and HerzegovinaBotswanaBrazilBritish Virgin IslandsBrunei DarussalamBulgariaBurkina FasoBurundiCabo VerdeCambodiaCameroonCanadaCaribbean small statesCayman IslandsCentral African RepublicCentral Europe and the BalticsChadChannel IslandsChileChinaColombiaComorosCongo, Dem. Rep.Congo, Rep.Costa RicaCote d'IvoireCroatiaCubaCuracaoCyprusCzech RepublicDenmarkDjiboutiDominicaDominican RepublicEarly-demographic dividendEast Asia & PacificEast Asia & Pacific (excluding high income)East Asia & Pacific (IDA & IBRD countries)EcuadorEgypt, Arab Rep.El SalvadorEquatorial GuineaEritreaEstoniaEthiopiaEuro areaEurope & Central AsiaEurope & Central Asia (excluding high income)Europe & Central Asia (IDA & IBRD countries)European UnionFaroe IslandsFijiFinlandFragile and conflict affected situationsFranceFrench PolynesiaGabonGambia, TheGeorgiaGermanyGhanaGibraltarGreeceGreenlandGrenadaGuamGuatemalaGuineaGuinea-BissauGuyanaHaitiHeavily indebted poor countries (HIPC)High incomeHondurasHong Kong SAR, ChinaHungaryIBRD onlyIcelandIDA & IBRD totalIDA blendIDA onlyIDA totalIndiaIndonesiaIran, Islamic Rep.IraqIrelandIsle of ManIsraelItalyJamaicaJapanJordanKazakhstanKenyaKiribatiKorea, Dem. People’s Rep.Korea, Rep.KuwaitKyrgyz RepublicLao PDRLate-demographic dividendLatin America & Caribbean Latin America & Caribbean (excluding high income)Latin America & the Caribbean (IDA & IBRD countries)LatviaLeast developed countries: UN classificationLebanonLesothoLiberiaLibyaLiechtensteinLithuaniaLow & middle incomeLow incomeLower middle incomeLuxembourgMacao SAR, ChinaMacedonia, FYRMadagascarMalawiMalaysiaMaldivesMaliMaltaMarshall IslandsMauritaniaMauritiusMexicoMicronesia, Fed. Sts.Middle East & North AfricaMiddle East & North Africa (excluding high income)Middle East & North Africa (IDA & IBRD countries)Middle incomeMoldovaMonacoMongoliaMontenegroMoroccoMozambiqueMyanmarNamibiaNauruNepalNetherlandsNew CaledoniaNew ZealandNicaraguaNigerNigeriaNorth AmericaNorthern Mariana IslandsNorwayOECD membersOmanOther small statesPacific island small statesPakistanPalauPanamaPapua New GuineaParaguayPeruPhilippinesPolandPortugalPost-demographic dividendPre-demographic dividendPuerto RicoQatarRomaniaRussian FederationRwandaSamoaSan MarinoSao Tome and PrincipeSaudi ArabiaSenegalSerbiaSeychellesSierra LeoneSingaporeSint Maarten (Dutch part)Slovak RepublicSloveniaSmall statesSolomon IslandsSomaliaSouth AfricaSouth AsiaSouth Asia (IDA & IBRD)South SudanSpainSri LankaSt. Kitts and NevisSt. LuciaSt. Vincent and the GrenadinesSub-Saharan Africa Sub-Saharan Africa (excluding high income)Sub-Saharan Africa (IDA & IBRD countries)SudanSurinameSwazilandSwedenSwitzerlandSyrian Arab RepublicTajikistanTanzaniaThailandTimor-LesteTogoTongaTrinidad and TobagoTunisiaTurkeyTurkmenistanTurks and Caicos IslandsTuvaluUgandaUkraineUnited Arab EmiratesUnited KingdomUnited StatesUpper middle incomeUruguayUzbekistanVanuatuVenezuela, RBVietnamVirgin Islands (U.S.)West Bank and GazaWorldYemen, Rep.ZambiaZimbabwe La ligne de temps
Cette échelle de temps montre un graphique de 1961 année à 2016 année Sub-Saharan Africa (IDA & IBRD countries). Les données jusqu'à 1960 année ne sont pas présentés. Quantité d'observations actuelles selon dates: 56.
Source (désignation):
Les indicateurs du développement mondiale
Source (organisation):
The data on urban population shares used to estimate rural population come from the United Nations, World Urbanization Prospects. Total population figures are World Bank estimates.
Catégories:
Agriculture & Rural Development
Dernière mise à jour
23 avr. 2017
Les indicateurs de changement de valeurs selon les années
Minimum:
194.87 mln.
1 janv. 1961
Maximum:
623.217 mln.
1 janv. 2016
Pour la date d''observation
Valeur
Changement absolu
Le changement par rapport à la valeur précédente
1 janv. 1961
194.87 mln.
+194.87 mln.
0.0%
1 janv. 1962
198.819 mln.
+3.949 mln.
2.03%
1 janv. 1963
202.87 mln.
+4.051 mln.
2.04%
1 janv. 1964
206.999 mln.
+4.129 mln.
2.04%
1 janv. 1965
211.219 mln.
+4.22 mln.
2.04%
1 janv. 1966
215.547 mln.
+4.328 mln.
2.05%
1 janv. 1967
220.028 mln.
+4.481 mln.
2.08%
1 janv. 1968
224.637 mln.
+4.609 mln.
2.09%
1 janv. 1969
229.371 mln.
+4.735 mln.
2.11%
1 janv. 1970
234.228 mln.
+4.857 mln.
2.12%
1 janv. 1971
239.265 mln.
+5.037 mln.
2.15%
1 janv. 1972
244.371 mln.
+5.105 mln.
2.13%
1 janv. 1973
249.589 mln.
+5.219 mln.
2.14%
1 janv. 1974
254.969 mln.
+5.38 mln.
2.16%
1 janv. 1975
260.542 mln.
+5.573 mln.
2.19%
1 janv. 1976
266.282 mln.
+5.74 mln.
2.2%
1 janv. 1977
272.181 mln.
+5.899 mln.
2.22%
1 janv. 1978
278.302 mln.
+6.121 mln.
2.25%
1 janv. 1979
284.591 mln.
+6.289 mln.
2.26%
1 janv. 1980
291.264 mln.
+6.673 mln.
2.34%
1 janv. 1981
298.19 mln.
+6.926 mln.
2.38%
1 janv. 1982
305.114 mln.
+6.924 mln.
2.32%
1 janv. 1983
312.18 mln.
+7.066 mln.
2.32%
1 janv. 1984
319.335 mln.
+7.156 mln.
2.29%
1 janv. 1985
326.529 mln.
+7.194 mln.
2.25%
1 janv. 1986
333.737 mln.
+7.208 mln.
2.21%
1 janv. 1987
341.033 mln.
+7.296 mln.
2.19%
1 janv. 1988
348.485 mln.
+7.451 mln.
2.18%
1 janv. 1989
356.048 mln.
+7.563 mln.
2.17%
1 janv. 1990
363.713 mln.
+7.664 mln.
2.15%
1 janv. 1991
371.325 mln.
+7.612 mln.
2.09%
1 janv. 1992
379.491 mln.
+8.167 mln.
2.2%
1 janv. 1993
387.86 mln.
+8.369 mln.
2.21%
1 janv. 1994
396.403 mln.
+8.543 mln.
2.2%
1 janv. 1995
405.346 mln.
+8.943 mln.
2.26%
1 janv. 1996
414.45 mln.
+9.104 mln.
2.25%
1 janv. 1997
423.701 mln.
+9.251 mln.
2.23%
1 janv. 1998
433.045 mln.
+9.344 mln.
2.21%
1 janv. 1999
442.609 mln.
+9.564 mln.
2.21%
1 janv. 2000
452.357 mln.
+9.748 mln.
2.2%
1 janv. 2001
462.309 mln.
+9.952 mln.
2.2%
1 janv. 2002
471.983 mln.
+9.674 mln.
2.09%
1 janv. 2003
481.632 mln.
+9.649 mln.
2.04%
1 janv. 2004
491.477 mln.
+9.845 mln.
2.04%
1 janv. 2005
501.549 mln.
+10.072 mln.
2.05%
1 janv. 2006
511.824 mln.
+10.275 mln.
2.05%
1 janv. 2007
522.347 mln.
+10.522 mln.
2.06%
1 janv. 2008
533.076 mln.
+10.729 mln.
2.05%
1 janv. 2009
543.869 mln.
+10.793 mln.
2.02%
1 janv. 2010
554.833 mln.
+10.965 mln.
2.02%
1 janv. 2011
565.926 mln.
+11.093 mln.
2.0%
1 janv. 2012
577.159 mln.
+11.233 mln.
1.98%
1 janv. 2013
588.526 mln.
+11.366 mln.
1.97%
1 janv. 2014
600.011 mln.
+11.485 mln.
1.95%
1 janv. 2015
611.581 mln.
+11.57 mln.
1.93%
1 janv. 2016
623.217 mln.
+11.636 mln.
1.9%
Classement des pays selon les statistiques actuelles par années


Commentaires: