29
/fr/
fr
AIzaSyAYiBZKx7MnpbEhh9jyipgxe19OcubqV5w
April 1, 2024
57634
South Asia
SAS
false
2
1
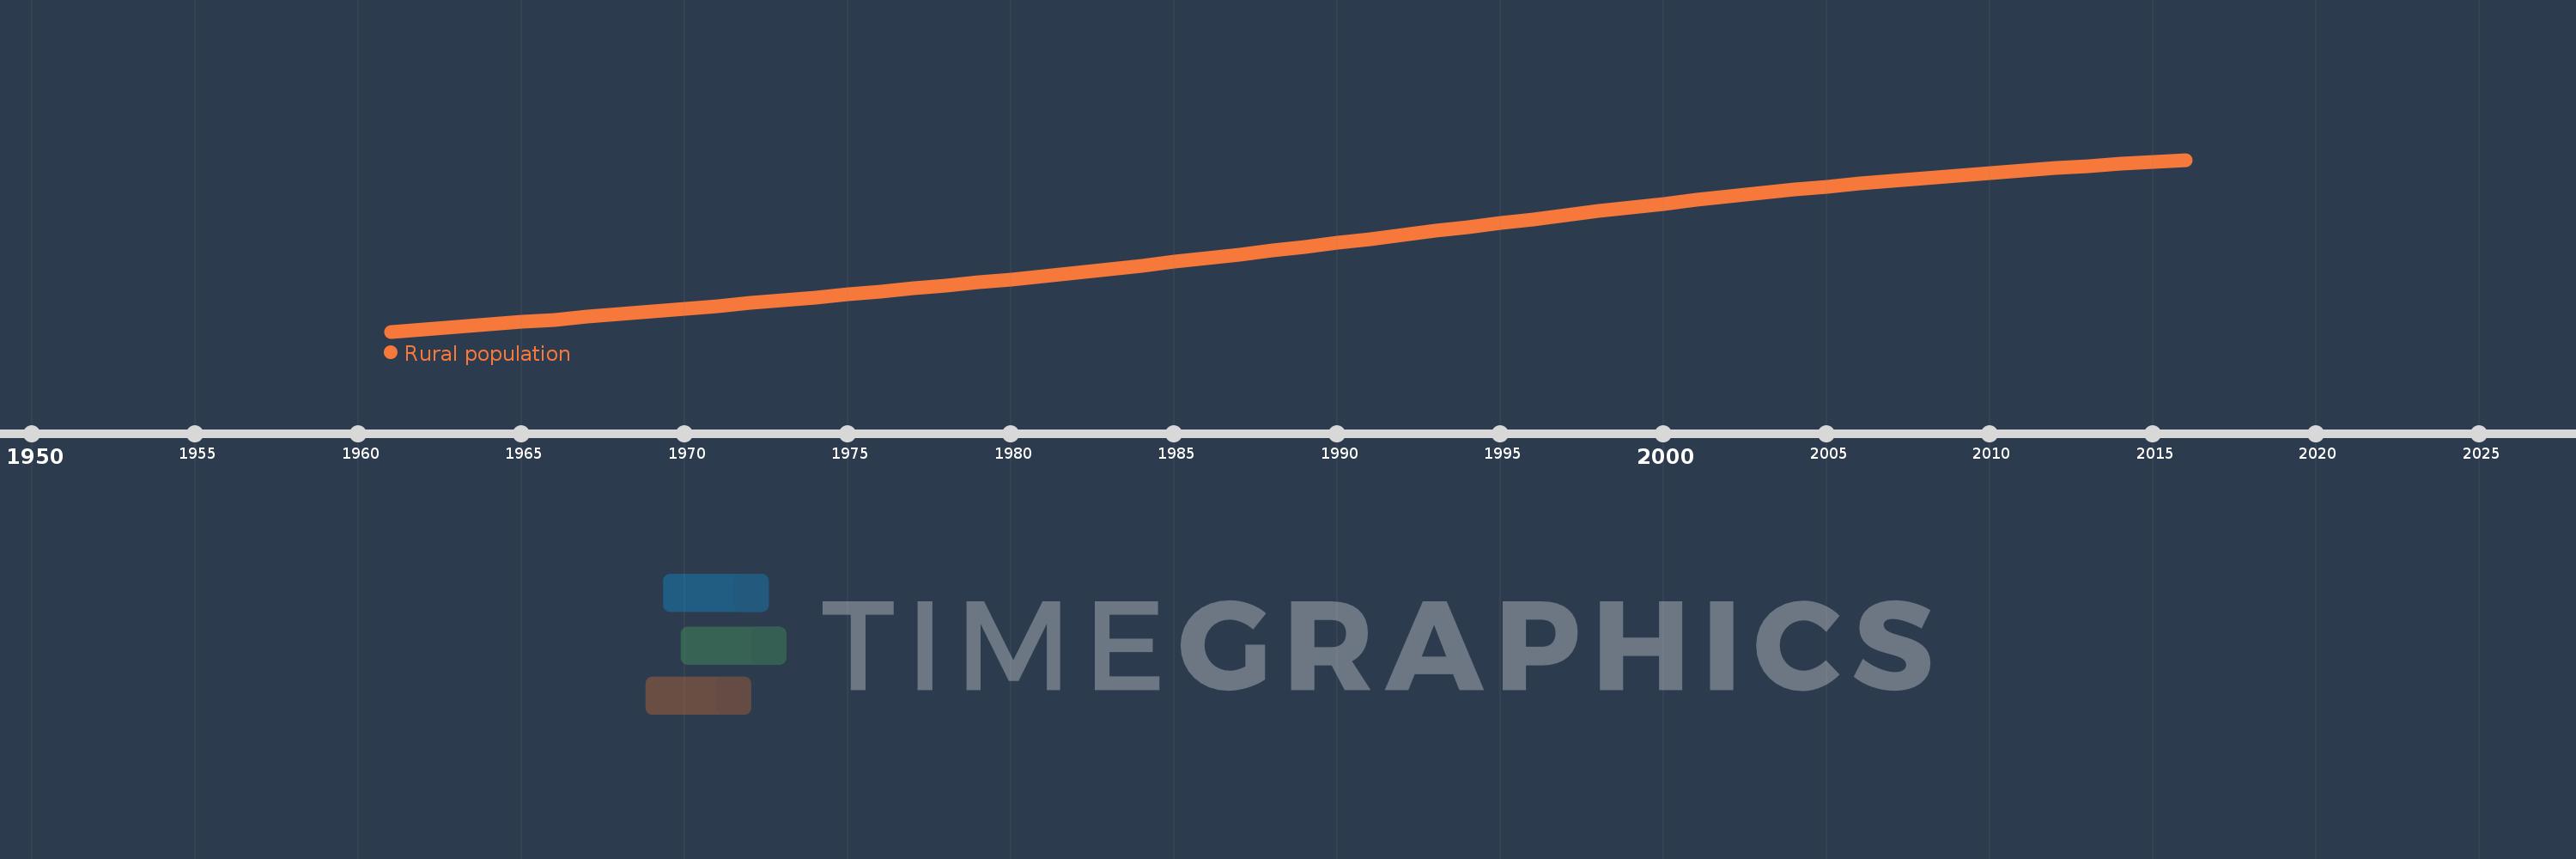
Rural population
2016,2015,2014,2013,2012,2011,2010,2009,2008,2007,2006,2005,2004,2003,2002,2001,2000,1999,1998,1997,1996,1995,1994,1993,1992,1991,1990,1989,1988,1987,1986,1985,1984,1983,1982,1981,1980,1979,1978,1977,1976,1975,1974,1973,1972,1971,1970,1969,1968,1967,1966,1965,1964,1963,1962,1961
Cette statistique dans les autres pays:
AfghanistanAlbaniaAlgeriaAmerican SamoaAndorraAngolaAntigua and BarbudaArab WorldArgentinaArmeniaArubaAustraliaAustriaAzerbaijanBahamas, TheBahrainBangladeshBarbadosBelarusBelgiumBelizeBeninBermudaBhutanBoliviaBosnia and HerzegovinaBotswanaBrazilBritish Virgin IslandsBrunei DarussalamBulgariaBurkina FasoBurundiCabo VerdeCambodiaCameroonCanadaCaribbean small statesCayman IslandsCentral African RepublicCentral Europe and the BalticsChadChannel IslandsChileChinaColombiaComorosCongo, Dem. Rep.Congo, Rep.Costa RicaCote d'IvoireCroatiaCubaCuracaoCyprusCzech RepublicDenmarkDjiboutiDominicaDominican RepublicEarly-demographic dividendEast Asia & PacificEast Asia & Pacific (excluding high income)East Asia & Pacific (IDA & IBRD countries)EcuadorEgypt, Arab Rep.El SalvadorEquatorial GuineaEritreaEstoniaEthiopiaEuro areaEurope & Central AsiaEurope & Central Asia (excluding high income)Europe & Central Asia (IDA & IBRD countries)European UnionFaroe IslandsFijiFinlandFragile and conflict affected situationsFranceFrench PolynesiaGabonGambia, TheGeorgiaGermanyGhanaGibraltarGreeceGreenlandGrenadaGuamGuatemalaGuineaGuinea-BissauGuyanaHaitiHeavily indebted poor countries (HIPC)High incomeHondurasHong Kong SAR, ChinaHungaryIBRD onlyIcelandIDA & IBRD totalIDA blendIDA onlyIDA totalIndiaIndonesiaIran, Islamic Rep.IraqIrelandIsle of ManIsraelItalyJamaicaJapanJordanKazakhstanKenyaKiribatiKorea, Dem. People’s Rep.Korea, Rep.KuwaitKyrgyz RepublicLao PDRLate-demographic dividendLatin America & Caribbean Latin America & Caribbean (excluding high income)Latin America & the Caribbean (IDA & IBRD countries)LatviaLeast developed countries: UN classificationLebanonLesothoLiberiaLibyaLiechtensteinLithuaniaLow & middle incomeLow incomeLower middle incomeLuxembourgMacao SAR, ChinaMacedonia, FYRMadagascarMalawiMalaysiaMaldivesMaliMaltaMarshall IslandsMauritaniaMauritiusMexicoMicronesia, Fed. Sts.Middle East & North AfricaMiddle East & North Africa (excluding high income)Middle East & North Africa (IDA & IBRD countries)Middle incomeMoldovaMonacoMongoliaMontenegroMoroccoMozambiqueMyanmarNamibiaNauruNepalNetherlandsNew CaledoniaNew ZealandNicaraguaNigerNigeriaNorth AmericaNorthern Mariana IslandsNorwayOECD membersOmanOther small statesPacific island small statesPakistanPalauPanamaPapua New GuineaParaguayPeruPhilippinesPolandPortugalPost-demographic dividendPre-demographic dividendPuerto RicoQatarRomaniaRussian FederationRwandaSamoaSan MarinoSao Tome and PrincipeSaudi ArabiaSenegalSerbiaSeychellesSierra LeoneSingaporeSint Maarten (Dutch part)Slovak RepublicSloveniaSmall statesSolomon IslandsSomaliaSouth AfricaSouth AsiaSouth Asia (IDA & IBRD)South SudanSpainSri LankaSt. Kitts and NevisSt. LuciaSt. Vincent and the GrenadinesSub-Saharan Africa Sub-Saharan Africa (excluding high income)Sub-Saharan Africa (IDA & IBRD countries)SudanSurinameSwazilandSwedenSwitzerlandSyrian Arab RepublicTajikistanTanzaniaThailandTimor-LesteTogoTongaTrinidad and TobagoTunisiaTurkeyTurkmenistanTurks and Caicos IslandsTuvaluUgandaUkraineUnited Arab EmiratesUnited KingdomUnited StatesUpper middle incomeUruguayUzbekistanVanuatuVenezuela, RBVietnamVirgin Islands (U.S.)West Bank and GazaWorldYemen, Rep.ZambiaZimbabwe La ligne de temps
Cette échelle de temps montre un graphique de 1961 année à 2016 année South Asia. Les données jusqu'à 1960 année ne sont pas présentés. Quantité d'observations actuelles selon dates: 56.
Source (désignation):
Les indicateurs du développement mondiale
Source (organisation):
The data on urban population shares used to estimate rural population come from the United Nations, World Urbanization Prospects. Total population figures are World Bank estimates.
Catégories:
Agriculture & Rural Development
Dernière mise à jour
23 avr. 2017
Les indicateurs de changement de valeurs selon les années
Minimum:
476.303 mln.
1 janv. 1961
Maximum:
1.168 mds
1 janv. 2016
Pour la date d''observation
Valeur
Changement absolu
Le changement par rapport à la valeur précédente
1 janv. 1961
476.303 mln.
+476.303 mln.
0.0%
1 janv. 1962
485.616 mln.
+9.313 mln.
1.96%
1 janv. 1963
494.937 mln.
+9.321 mln.
1.92%
1 janv. 1964
504.459 mln.
+9.522 mln.
1.92%
1 janv. 1965
514.416 mln.
+9.957 mln.
1.97%
1 janv. 1966
524.639 mln.
+10.223 mln.
1.99%
1 janv. 1967
535.184 mln.
+10.545 mln.
2.01%
1 janv. 1968
546.025 mln.
+10.84 mln.
2.03%
1 janv. 1969
557.162 mln.
+11.137 mln.
2.04%
1 janv. 1970
568.512 mln.
+11.35 mln.
2.04%
1 janv. 1971
580.07 mln.
+11.558 mln.
2.03%
1 janv. 1972
591.568 mln.
+11.498 mln.
1.98%
1 janv. 1973
602.727 mln.
+11.159 mln.
1.89%
1 janv. 1974
614.143 mln.
+11.417 mln.
1.89%
1 janv. 1975
625.693 mln.
+11.549 mln.
1.88%
1 janv. 1976
637.364 mln.
+11.672 mln.
1.87%
1 janv. 1977
649.322 mln.
+11.958 mln.
1.88%
1 janv. 1978
661.526 mln.
+12.204 mln.
1.88%
1 janv. 1979
673.946 mln.
+12.419 mln.
1.88%
1 janv. 1980
686.531 mln.
+12.585 mln.
1.87%
1 janv. 1981
699.219 mln.
+12.688 mln.
1.85%
1 janv. 1982
712.42 mln.
+13.201 mln.
1.89%
1 janv. 1983
727.083 mln.
+14.663 mln.
2.06%
1 janv. 1984
741.927 mln.
+14.845 mln.
2.04%
1 janv. 1985
756.934 mln.
+15.006 mln.
2.02%
1 janv. 1986
772.094 mln.
+15.16 mln.
2.0%
1 janv. 1987
787.374 mln.
+15.28 mln.
1.98%
1 janv. 1988
802.76 mln.
+15.386 mln.
1.95%
1 janv. 1989
818.222 mln.
+15.462 mln.
1.93%
1 janv. 1990
833.752 mln.
+15.53 mln.
1.9%
1 janv. 1991
849.338 mln.
+15.586 mln.
1.87%
1 janv. 1992
865.121 mln.
+15.783 mln.
1.86%
1 janv. 1993
881.25 mln.
+16.129 mln.
1.86%
1 janv. 1994
897.368 mln.
+16.118 mln.
1.83%
1 janv. 1995
913.413 mln.
+16.045 mln.
1.79%
1 janv. 1996
929.364 mln.
+15.951 mln.
1.75%
1 janv. 1997
945.153 mln.
+15.789 mln.
1.7%
1 janv. 1998
960.779 mln.
+15.626 mln.
1.65%
1 janv. 1999
976.242 mln.
+15.463 mln.
1.61%
1 janv. 2000
991.533 mln.
+15.291 mln.
1.57%
1 janv. 2001
1.007 mds
+15.11 mln.
1.52%
1 janv. 2002
1.021 mds
+14.4 mln.
1.43%
1 janv. 2003
1.034 mds
+13.208 mln.
1.29%
1 janv. 2004
1.047 mds
+12.85 mln.
1.24%
1 janv. 2005
1.059 mds
+12.396 mln.
1.18%
1 janv. 2006
1.071 mds
+11.915 mln.
1.12%
1 janv. 2007
1.083 mds
+11.392 mln.
1.06%
1 janv. 2008
1.094 mds
+10.881 mln.
1.0%
1 janv. 2009
1.104 mds
+10.43 mln.
0.95%
1 janv. 2010
1.114 mds
+10.09 mln.
0.91%
1 janv. 2011
1.124 mds
+9.814 mln.
0.88%
1 janv. 2012
1.134 mds
+9.532 mln.
0.85%
1 janv. 2013
1.143 mds
+9.163 mln.
0.81%
1 janv. 2014
1.152 mds
+8.813 mln.
0.77%
1 janv. 2015
1.16 mds
+8.473 mln.
0.74%
1 janv. 2016
1.168 mds
+8.097 mln.
0.7%
Classement des pays selon les statistiques actuelles par années


Commentaires: