29
/fr/
fr
AIzaSyAYiBZKx7MnpbEhh9jyipgxe19OcubqV5w
April 1, 2024
60007
Sub-Saharan Africa (excluding high income)
SSA
false
2
1
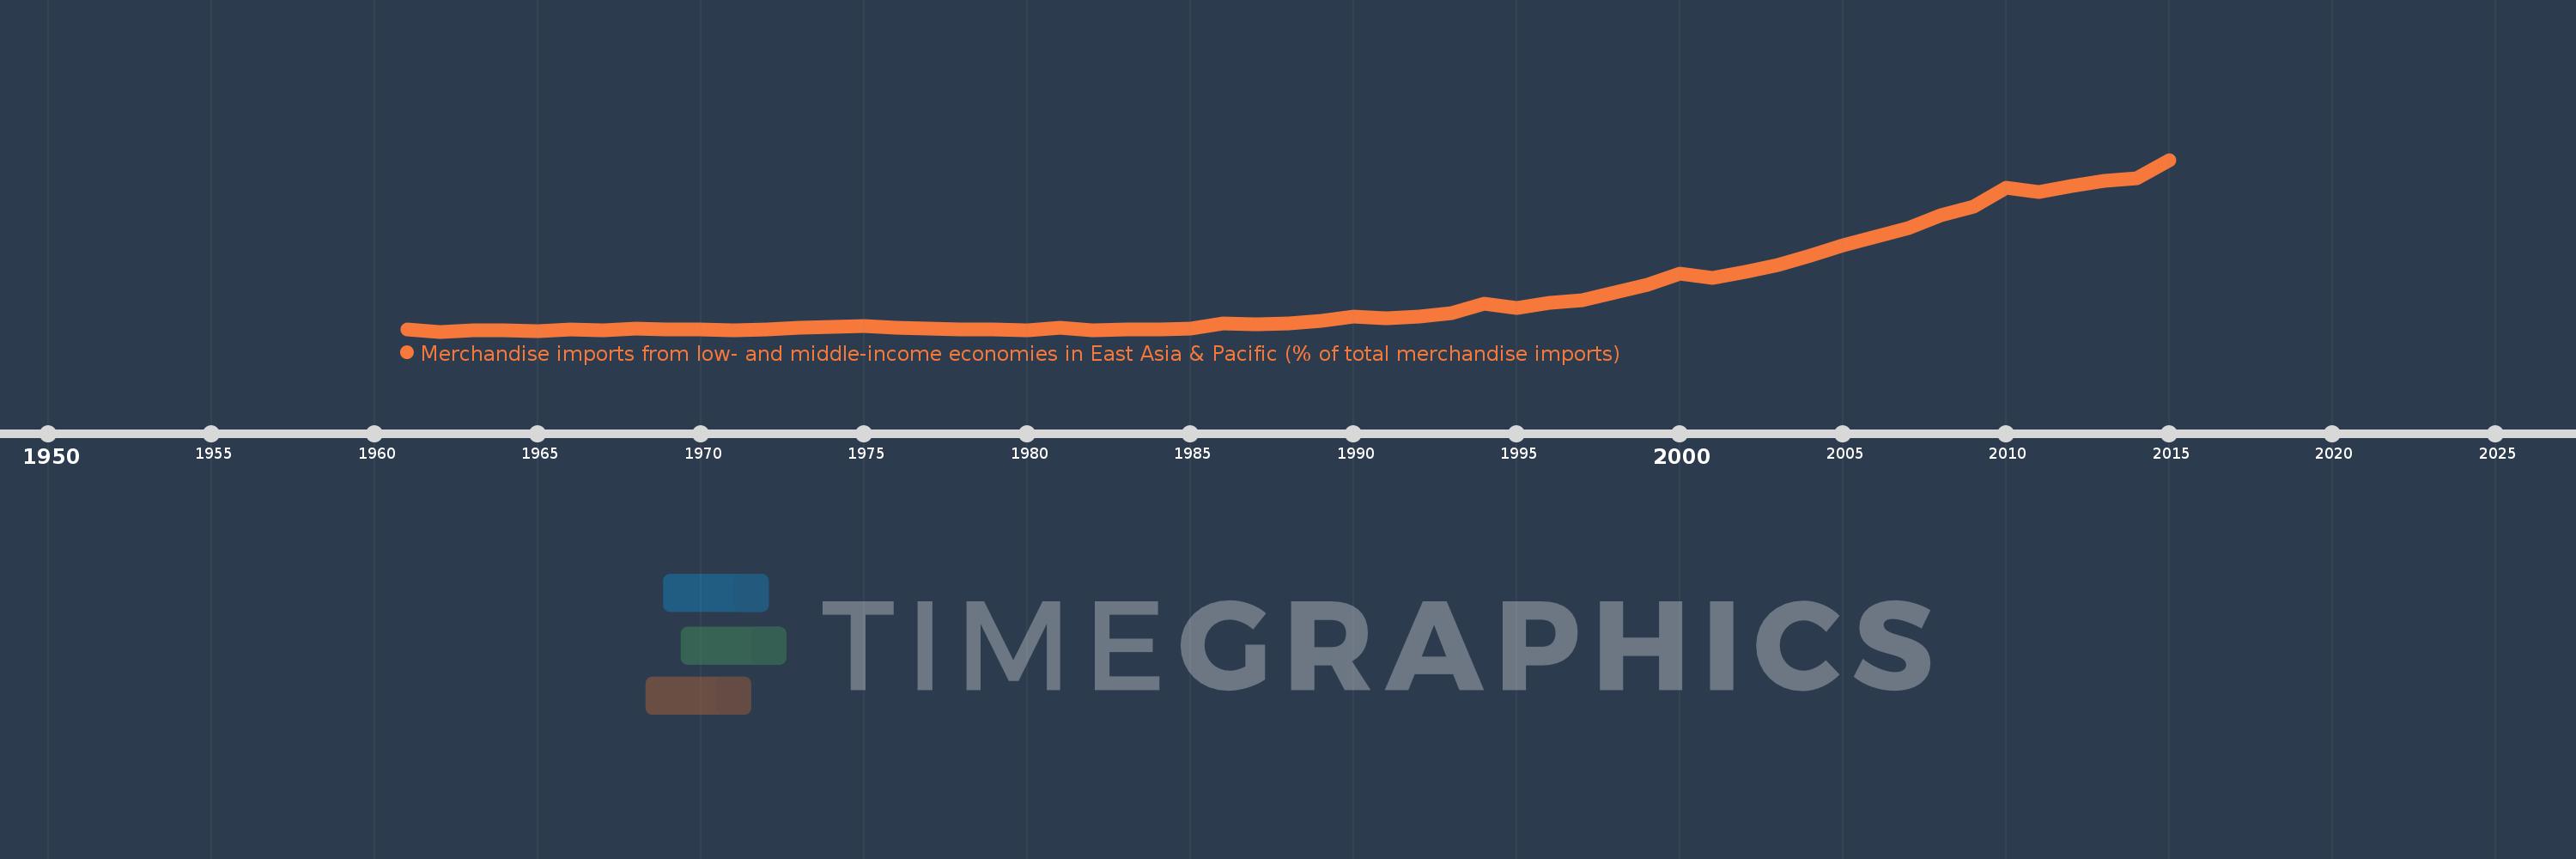
Merchandise imports from low- and middle-income economies in East Asia & Pacific (% of total merchandise imports)
2015,2014,2013,2012,2011,2010,2009,2008,2007,2006,2005,2004,2003,2002,2001,2000,1999,1998,1997,1996,1995,1994,1993,1992,1991,1990,1989,1988,1987,1986,1985,1984,1983,1982,1981,1980,1979,1978,1977,1976,1975,1974,1973,1972,1971,1970,1969,1968,1967,1966,1965,1964,1963,1962,1961
Cette statistique dans les autres pays:
AfghanistanAlbaniaAlgeriaArab WorldArgentinaArmeniaArubaAustraliaAustriaAzerbaijanBahamas, TheBahrainBangladeshBarbadosBelarusBelgiumBelizeBeninBermudaBoliviaBrazilBrunei DarussalamBulgariaBurkina FasoBurundiCabo VerdeCambodiaCameroonCanadaCaribbean small statesCentral African RepublicCentral Europe and the BalticsChileChinaColombiaCongo, Rep.Costa RicaCote d'IvoireCroatiaCyprusCzech RepublicDenmarkDominicaDominican RepublicEarly-demographic dividendEast Asia & PacificEast Asia & Pacific (excluding high income)East Asia & Pacific (IDA & IBRD countries)EcuadorEgypt, Arab Rep.El SalvadorEstoniaEthiopiaEuro areaEurope & Central AsiaEurope & Central Asia (excluding high income)Europe & Central Asia (IDA & IBRD countries)European UnionFijiFinlandFragile and conflict affected situationsFranceFrench PolynesiaGabonGambia, TheGeorgiaGermanyGhanaGreeceGreenlandGrenadaGuatemalaHaitiHeavily indebted poor countries (HIPC)High incomeHondurasHong Kong SAR, ChinaHungaryIBRD onlyIcelandIDA & IBRD totalIDA blendIDA onlyIDA totalIndiaIndonesiaIran, Islamic Rep.IraqIrelandIsraelItalyJamaicaJapanJordanKazakhstanKenyaKorea, Dem. People’s Rep.Korea, Rep.KuwaitKyrgyz RepublicLao PDRLate-demographic dividendLatin America & Caribbean Latin America & Caribbean (excluding high income)Latin America & the Caribbean (IDA & IBRD countries)LatviaLeast developed countries: UN classificationLebanonLithuaniaLow & middle incomeLow incomeLower middle incomeLuxembourgMacao SAR, ChinaMacedonia, FYRMadagascarMalaysiaMaliMaltaMauritiusMexicoMiddle East & North AfricaMiddle East & North Africa (excluding high income)Middle East & North Africa (IDA & IBRD countries)Middle incomeMoldovaMongoliaMontenegroMoroccoMyanmarNetherlandsNew CaledoniaNew ZealandNicaraguaNigerNigeriaNorth AmericaNorwayOECD membersOmanOther small statesPacific island small statesPakistanPanamaPapua New GuineaParaguayPeruPhilippinesPolandPortugalPost-demographic dividendPre-demographic dividendQatarRomaniaRussian FederationSamoaSaudi ArabiaSenegalSerbiaSingaporeSlovak RepublicSloveniaSmall statesSolomon IslandsSomaliaSouth AfricaSouth AsiaSouth Asia (IDA & IBRD)SpainSri LankaSt. Kitts and NevisSt. LuciaSt. Vincent and the GrenadinesSub-Saharan Africa Sub-Saharan Africa (excluding high income)Sub-Saharan Africa (IDA & IBRD countries)SurinameSwedenSwitzerlandTanzaniaThailandTogoTongaTrinidad and TobagoTunisiaTurkeyUgandaUkraineUnited Arab EmiratesUnited KingdomUnited StatesUpper middle incomeUruguayVanuatuVenezuela, RBVietnamWorldYemen, Rep.ZambiaZimbabwe La ligne de temps
Cette échelle de temps montre un graphique de 1961 année à 2015 année Sub-Saharan Africa (excluding high income). Les données jusqu'à 1960 année ne sont pas présentés. Quantité d'observations actuelles selon dates: 55.
Source (désignation):
Les indicateurs du développement mondiale
Source (organisation):
World Bank staff estimates based data from International Monetary Fund's Direction of Trade database.
Catégories:
Private Sector, Trade
Dernière mise à jour
23 avr. 2017
Les indicateurs de changement de valeurs selon les années
Maximum:
18.106
1 janv. 2015
Pour la date d''observation
Valeur
Changement absolu
Le changement par rapport à la valeur précédente
1 janv. 1961
0.325
+0.325
0.0%
1 janv. 1962
0.1
-0.226
-69.36%
1 janv. 1963
0.224
+0.124
124.41%
1 janv. 1964
0.236
+0.012
5.37%
1 janv. 1965
0.13
-0.106
-44.81%
1 janv. 1966
0.339
+0.209
160.6%
1 janv. 1967
0.252
-0.087
-25.67%
1 janv. 1968
0.391
+0.139
55.28%
1 janv. 1969
0.318
-0.074
-18.8%
1 janv. 1970
0.327
+0.01
3.06%
1 janv. 1971
0.256
-0.072
-21.86%
1 janv. 1972
0.359
+0.103
40.38%
1 janv. 1973
0.499
+0.14
39.0%
1 janv. 1974
0.573
+0.074
14.86%
1 janv. 1975
0.659
+0.086
15.0%
1 janv. 1976
0.505
-0.154
-23.32%
1 janv. 1977
0.372
-0.134
-26.45%
1 janv. 1978
0.338
-0.033
-9.01%
1 janv. 1979
0.342
+0.004
1.07%
1 janv. 1980
0.24
-0.102
-29.86%
1 janv. 1981
0.49
+0.251
104.46%
1 janv. 1982
0.257
-0.233
-47.54%
1 janv. 1983
0.35
+0.092
35.92%
1 janv. 1984
0.283
-0.066
-18.93%
1 janv. 1985
0.441
+0.158
55.64%
1 janv. 1986
0.924
+0.483
109.48%
1 janv. 1987
0.875
-0.049
-5.27%
1 janv. 1988
0.988
+0.113
12.91%
1 janv. 1989
1.215
+0.226
22.89%
1 janv. 1990
1.681
+0.466
38.4%
1 janv. 1991
1.466
-0.215
-12.82%
1 janv. 1992
1.699
+0.233
15.9%
1 janv. 1993
2.062
+0.363
21.38%
1 janv. 1994
2.992
+0.931
45.13%
1 janv. 1995
2.597
-0.395
-13.2%
1 janv. 1996
3.1
+0.503
19.36%
1 janv. 1997
3.349
+0.249
8.04%
1 janv. 1998
4.18
+0.831
24.81%
1 janv. 1999
5.039
+0.859
20.55%
1 janv. 2000
6.22
+1.181
23.44%
1 janv. 2001
5.758
-0.463
-7.44%
1 janv. 2002
6.368
+0.611
10.61%
1 janv. 2003
7.091
+0.723
11.35%
1 janv. 2004
8.074
+0.983
13.86%
1 janv. 2005
9.133
+1.059
13.12%
1 janv. 2006
10.02
+0.887
9.71%
1 janv. 2007
10.991
+0.971
9.69%
1 janv. 2008
12.295
+1.304
11.87%
1 janv. 2009
13.213
+0.918
7.47%
1 janv. 2010
15.19
+1.977
14.96%
1 janv. 2011
14.735
-0.455
-3.0%
1 janv. 2012
15.365
+0.63
4.28%
1 janv. 2013
15.903
+0.538
3.5%
1 janv. 2014
16.137
+0.234
1.47%
1 janv. 2015
18.106
+1.969
12.2%
Classement des pays selon les statistiques actuelles par années


Commentaires: