29
/fr/
fr
AIzaSyAYiBZKx7MnpbEhh9jyipgxe19OcubqV5w
April 1, 2024
30070
Euro area
EMU
false
2
1
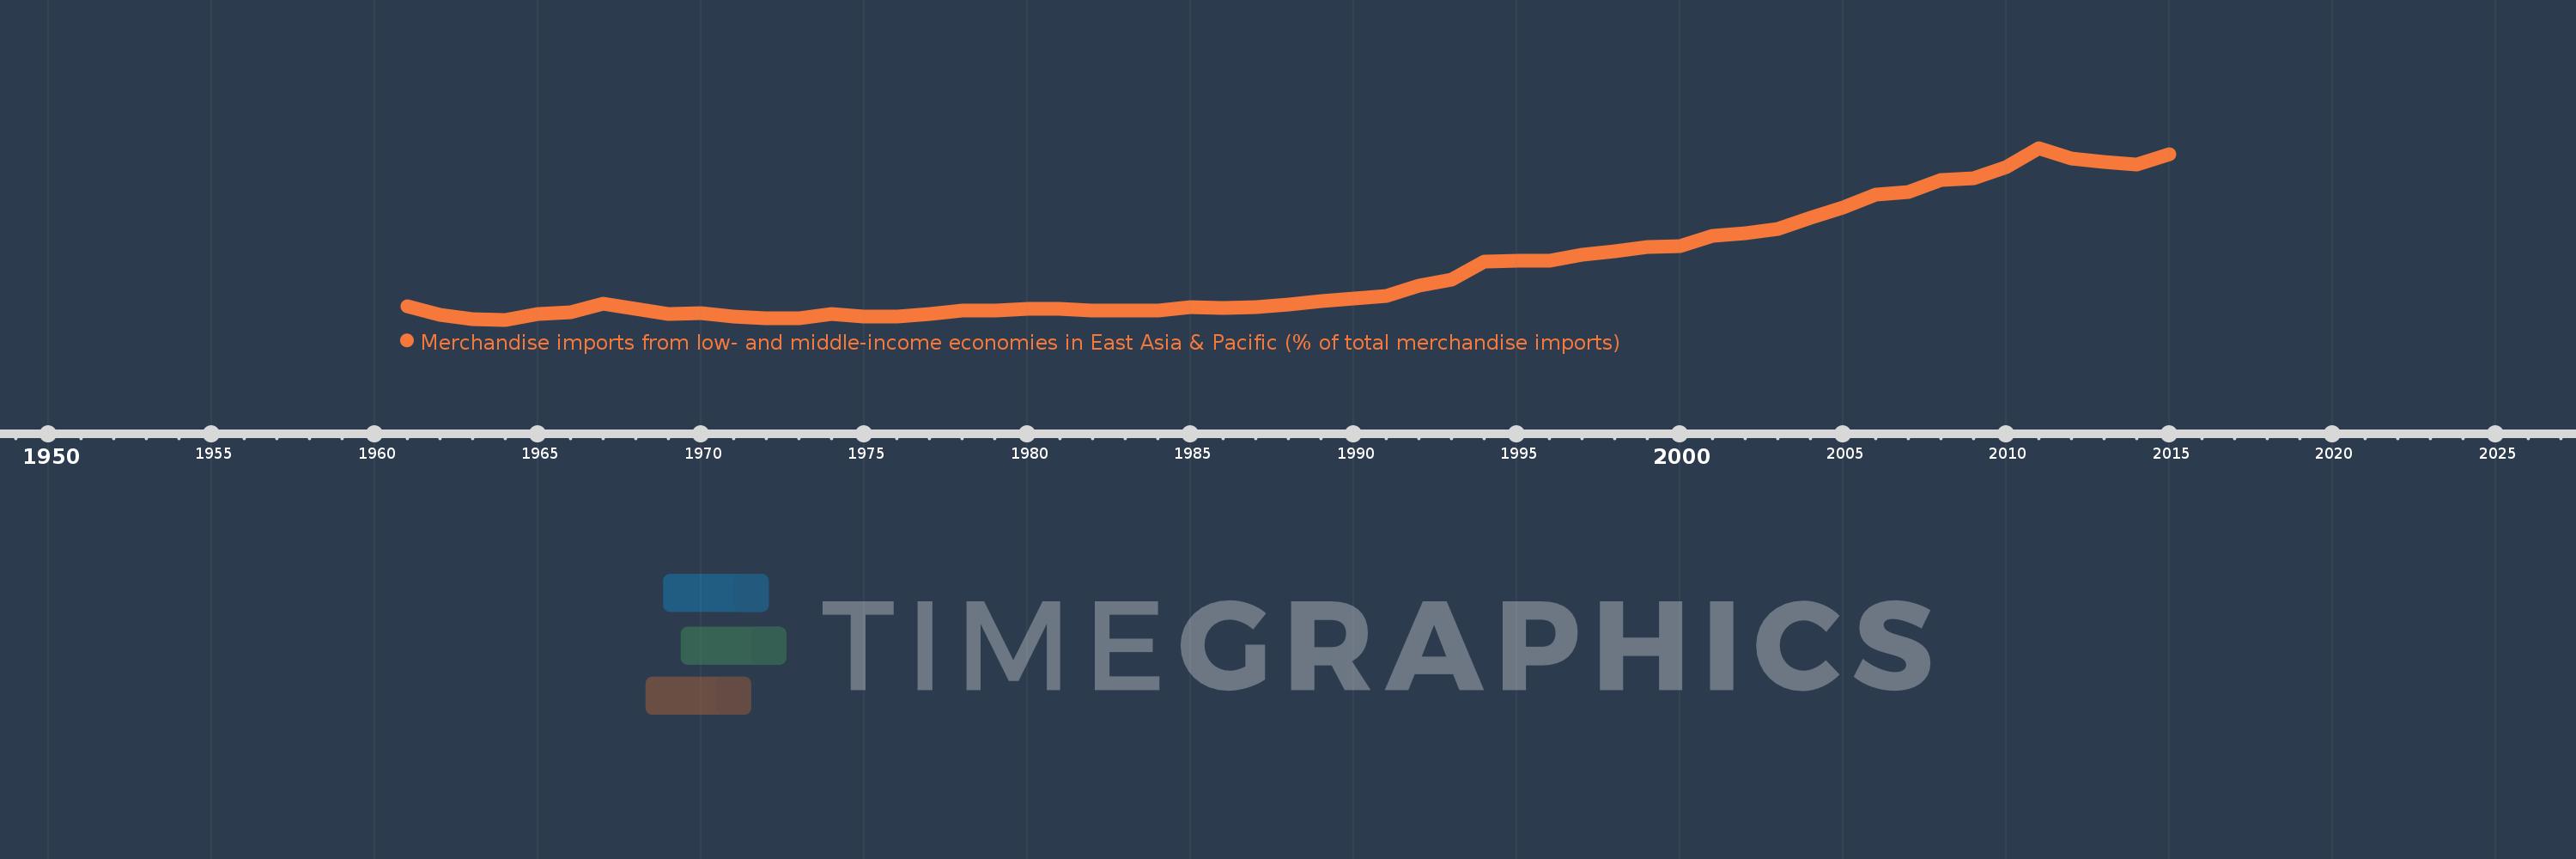
Merchandise imports from low- and middle-income economies in East Asia & Pacific (% of total merchandise imports)
2015,2014,2013,2012,2011,2010,2009,2008,2007,2006,2005,2004,2003,2002,2001,2000,1999,1998,1997,1996,1995,1994,1993,1992,1991,1990,1989,1988,1987,1986,1985,1984,1983,1982,1981,1980,1979,1978,1977,1976,1975,1974,1973,1972,1971,1970,1969,1968,1967,1966,1965,1964,1963,1962,1961
Cette statistique dans les autres pays:
AfghanistanAlbaniaAlgeriaArab WorldArgentinaArmeniaArubaAustraliaAustriaAzerbaijanBahamas, TheBahrainBangladeshBarbadosBelarusBelgiumBelizeBeninBermudaBoliviaBrazilBrunei DarussalamBulgariaBurkina FasoBurundiCabo VerdeCambodiaCameroonCanadaCaribbean small statesCentral African RepublicCentral Europe and the BalticsChileChinaColombiaCongo, Rep.Costa RicaCote d'IvoireCroatiaCyprusCzech RepublicDenmarkDominicaDominican RepublicEarly-demographic dividendEast Asia & PacificEast Asia & Pacific (excluding high income)East Asia & Pacific (IDA & IBRD countries)EcuadorEgypt, Arab Rep.El SalvadorEstoniaEthiopiaEuro areaEurope & Central AsiaEurope & Central Asia (excluding high income)Europe & Central Asia (IDA & IBRD countries)European UnionFijiFinlandFragile and conflict affected situationsFranceFrench PolynesiaGabonGambia, TheGeorgiaGermanyGhanaGreeceGreenlandGrenadaGuatemalaHaitiHeavily indebted poor countries (HIPC)High incomeHondurasHong Kong SAR, ChinaHungaryIBRD onlyIcelandIDA & IBRD totalIDA blendIDA onlyIDA totalIndiaIndonesiaIran, Islamic Rep.IraqIrelandIsraelItalyJamaicaJapanJordanKazakhstanKenyaKorea, Dem. People’s Rep.Korea, Rep.KuwaitKyrgyz RepublicLao PDRLate-demographic dividendLatin America & Caribbean Latin America & Caribbean (excluding high income)Latin America & the Caribbean (IDA & IBRD countries)LatviaLeast developed countries: UN classificationLebanonLithuaniaLow & middle incomeLow incomeLower middle incomeLuxembourgMacao SAR, ChinaMacedonia, FYRMadagascarMalaysiaMaliMaltaMauritiusMexicoMiddle East & North AfricaMiddle East & North Africa (excluding high income)Middle East & North Africa (IDA & IBRD countries)Middle incomeMoldovaMongoliaMontenegroMoroccoMyanmarNetherlandsNew CaledoniaNew ZealandNicaraguaNigerNigeriaNorth AmericaNorwayOECD membersOmanOther small statesPacific island small statesPakistanPanamaPapua New GuineaParaguayPeruPhilippinesPolandPortugalPost-demographic dividendPre-demographic dividendQatarRomaniaRussian FederationSamoaSaudi ArabiaSenegalSerbiaSingaporeSlovak RepublicSloveniaSmall statesSolomon IslandsSomaliaSouth AfricaSouth AsiaSouth Asia (IDA & IBRD)SpainSri LankaSt. Kitts and NevisSt. LuciaSt. Vincent and the GrenadinesSub-Saharan Africa Sub-Saharan Africa (excluding high income)Sub-Saharan Africa (IDA & IBRD countries)SurinameSwedenSwitzerlandTanzaniaThailandTogoTongaTrinidad and TobagoTunisiaTurkeyUgandaUkraineUnited Arab EmiratesUnited KingdomUnited StatesUpper middle incomeUruguayVanuatuVenezuela, RBVietnamWorldYemen, Rep.ZambiaZimbabwe La ligne de temps
Cette échelle de temps montre un graphique de 1961 année à 2015 année Euro area. Les données jusqu'à 1960 année ne sont pas présentés. Quantité d'observations actuelles selon dates: 55.
Source (désignation):
Les indicateurs du développement mondiale
Source (organisation):
World Bank staff estimates based data from International Monetary Fund's Direction of Trade database.
Catégories:
Private Sector, Trade
Dernière mise à jour
23 avr. 2017
Les indicateurs de changement de valeurs selon les années
Minimum:
1.009
1 janv. 1964
Maximum:
8.727
1 janv. 2011
Pour la date d''observation
Valeur
Changement absolu
Le changement par rapport à la valeur précédente
1 janv. 1961
1.624
+1.624
0.0%
1 janv. 1962
1.215
-0.409
-25.19%
1 janv. 1963
1.05
-0.165
-13.6%
1 janv. 1964
1.009
-0.041
-3.91%
1 janv. 1965
1.267
+0.258
25.6%
1 janv. 1966
1.337
+0.07
5.55%
1 janv. 1967
1.712
+0.375
28.02%
1 janv. 1968
1.484
-0.228
-13.34%
1 janv. 1969
1.284
-0.199
-13.43%
1 janv. 1970
1.287
+0.002
0.19%
1 janv. 1971
1.136
-0.151
-11.73%
1 janv. 1972
1.091
-0.045
-3.93%
1 janv. 1973
1.081
-0.01
-0.91%
1 janv. 1974
1.271
+0.19
17.6%
1 janv. 1975
1.163
-0.109
-8.54%
1 janv. 1976
1.135
-0.027
-2.35%
1 janv. 1977
1.281
+0.146
12.82%
1 janv. 1978
1.404
+0.123
9.59%
1 janv. 1979
1.433
+0.029
2.05%
1 janv. 1980
1.505
+0.072
5.02%
1 janv. 1981
1.496
-0.009
-0.6%
1 janv. 1982
1.438
-0.058
-3.85%
1 janv. 1983
1.405
-0.033
-2.3%
1 janv. 1984
1.43
+0.026
1.82%
1 janv. 1985
1.561
+0.13
9.1%
1 janv. 1986
1.533
-0.028
-1.76%
1 janv. 1987
1.569
+0.036
2.37%
1 janv. 1988
1.696
+0.126
8.04%
1 janv. 1989
1.858
+0.163
9.6%
1 janv. 1990
1.966
+0.108
5.8%
1 janv. 1991
2.062
+0.096
4.86%
1 janv. 1992
2.55
+0.488
23.65%
1 janv. 1993
2.809
+0.26
10.19%
1 janv. 1994
3.627
+0.818
29.11%
1 janv. 1995
3.656
+0.029
0.79%
1 janv. 1996
3.674
+0.019
0.51%
1 janv. 1997
3.947
+0.272
7.41%
1 janv. 1998
4.094
+0.147
3.73%
1 janv. 1999
4.262
+0.168
4.11%
1 janv. 2000
4.298
+0.036
0.84%
1 janv. 2001
4.774
+0.476
11.07%
1 janv. 2002
4.884
+0.11
2.31%
1 janv. 2003
5.102
+0.217
4.45%
1 janv. 2004
5.584
+0.482
9.45%
1 janv. 2005
6.039
+0.455
8.15%
1 janv. 2006
6.631
+0.592
9.8%
1 janv. 2007
6.745
+0.114
1.72%
1 janv. 2008
7.282
+0.536
7.95%
1 janv. 2009
7.347
+0.066
0.9%
1 janv. 2010
7.848
+0.5
6.81%
1 janv. 2011
8.727
+0.879
11.2%
1 janv. 2012
8.235
-0.491
-5.63%
1 janv. 2013
8.11
-0.125
-1.52%
1 janv. 2014
7.994
-0.116
-1.43%
1 janv. 2015
8.451
+0.457
5.71%
Classement des pays selon les statistiques actuelles par années


Commentaires: