29
/fr/
fr
AIzaSyAYiBZKx7MnpbEhh9jyipgxe19OcubqV5w
April 1, 2024
59599
Sub-Saharan Africa (excluding high income)
SSA
false
2
1
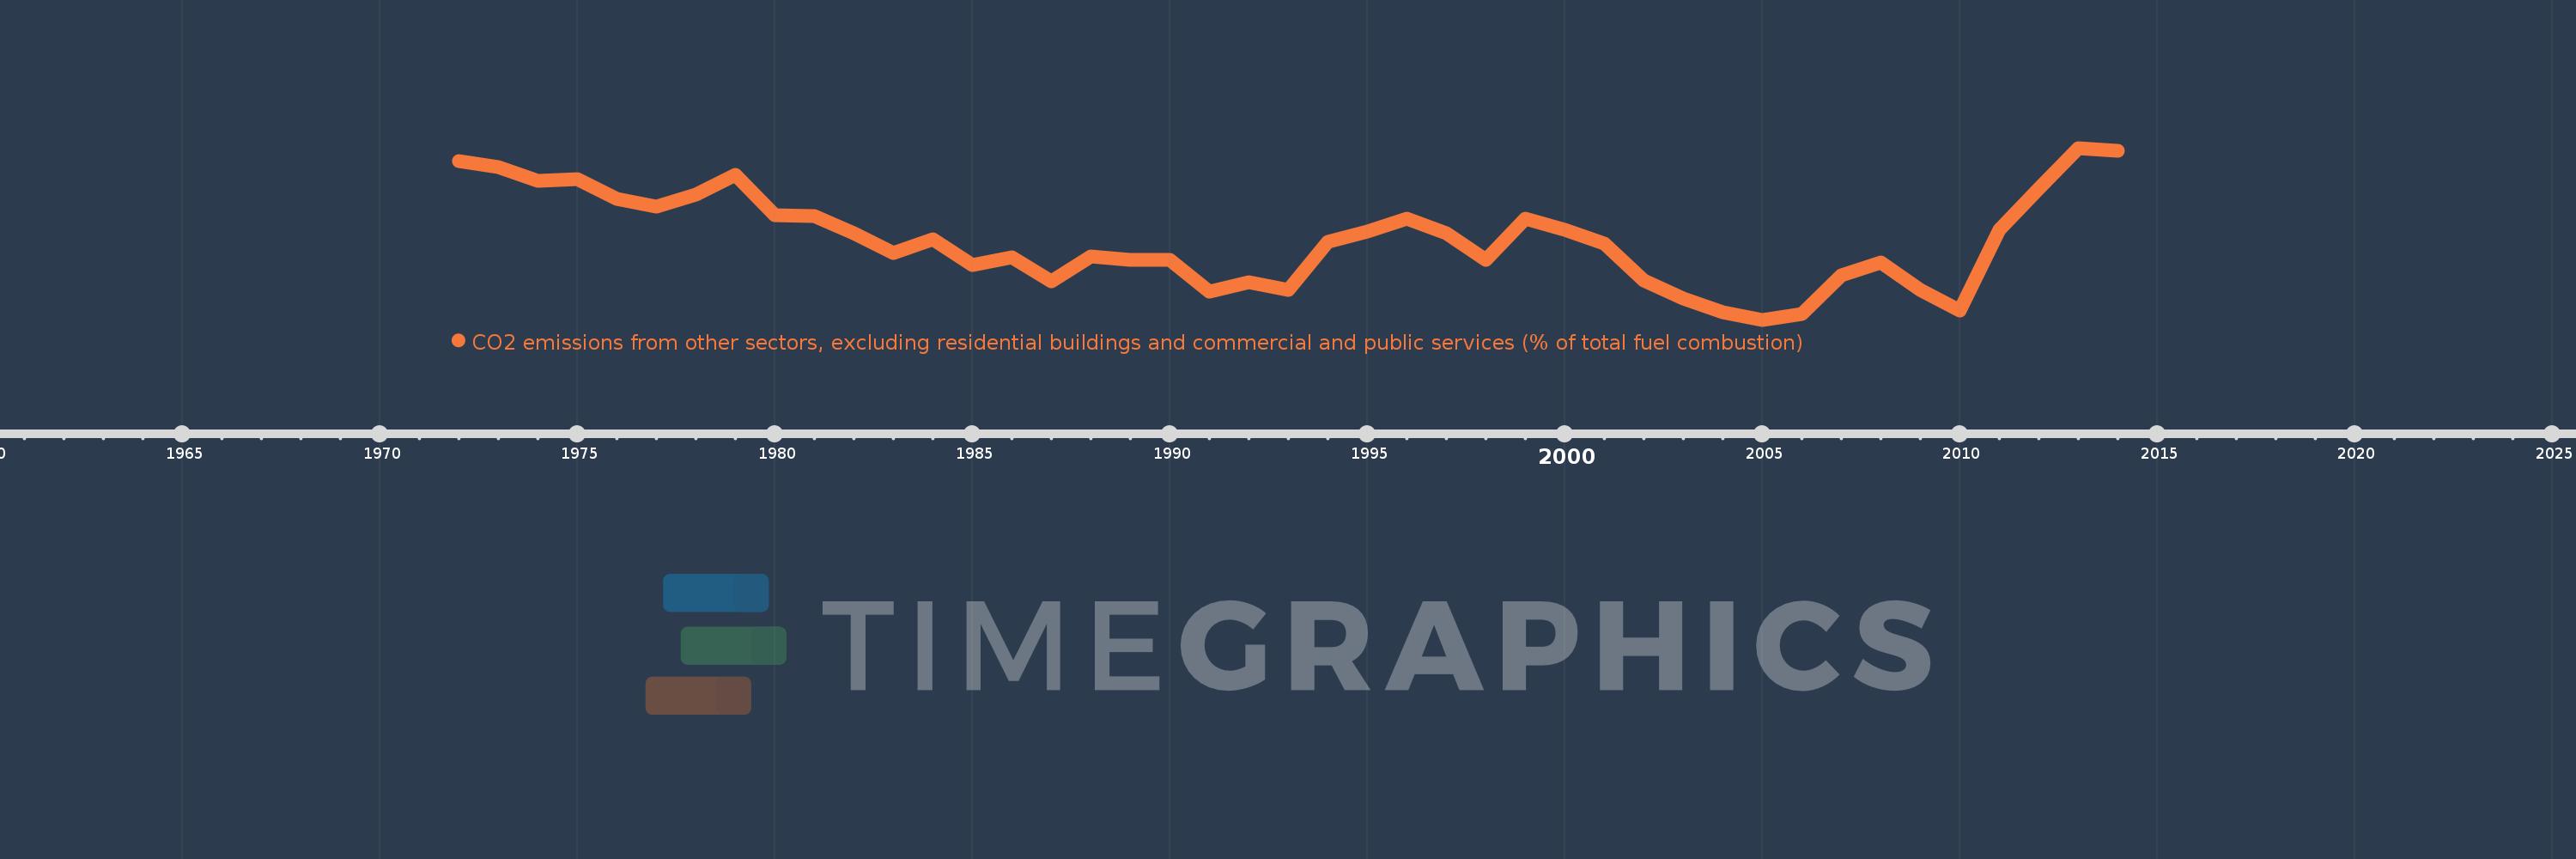
CO2 emissions from other sectors, excluding residential buildings and commercial and public services (% of total fuel combustion)
2014,2013,2012,2011,2010,2009,2008,2007,2006,2005,2004,2003,2002,2001,2000,1999,1998,1997,1996,1995,1994,1993,1992,1991,1990,1989,1988,1987,1986,1985,1984,1983,1982,1981,1980,1979,1978,1977,1976,1975,1974,1973,1972
Cette statistique dans les autres pays:
AlbaniaAlgeriaAngolaArab WorldArgentinaArmeniaAustraliaAustriaAzerbaijanBahrainBangladeshBelarusBelgiumBeninBoliviaBosnia and HerzegovinaBotswanaBrazilBrunei DarussalamBulgariaCambodiaCameroonCanadaCaribbean small statesCentral Europe and the BalticsChileChinaColombiaCongo, Dem. Rep.Congo, Rep.Costa RicaCote d'IvoireCroatiaCubaCuracaoCyprusCzech RepublicDenmarkDominican RepublicEarly-demographic dividendEast Asia & PacificEast Asia & Pacific (excluding high income)East Asia & Pacific (IDA & IBRD countries)EcuadorEgypt, Arab Rep.El SalvadorEritreaEstoniaEthiopiaEuro areaEurope & Central AsiaEurope & Central Asia (excluding high income)Europe & Central Asia (IDA & IBRD countries)European UnionFinlandFragile and conflict affected situationsFranceGabonGeorgiaGermanyGhanaGibraltarGreeceGuatemalaHaitiHeavily indebted poor countries (HIPC)High incomeHondurasHong Kong SAR, ChinaHungaryIBRD onlyIcelandIDA & IBRD totalIDA blendIDA onlyIDA totalIndiaIndonesiaIran, Islamic Rep.IraqIrelandIsraelItalyJamaicaJapanJordanKazakhstanKenyaKorea, Dem. People’s Rep.Korea, Rep.KosovoKuwaitKyrgyz RepublicLate-demographic dividendLatin America & Caribbean Latin America & Caribbean (excluding high income)Latin America & the Caribbean (IDA & IBRD countries)LatviaLeast developed countries: UN classificationLebanonLibyaLithuaniaLow & middle incomeLow incomeLower middle incomeLuxembourgMacedonia, FYRMalaysiaMaltaMauritiusMexicoMiddle East & North AfricaMiddle East & North Africa (excluding high income)Middle East & North Africa (IDA & IBRD countries)Middle incomeMoldovaMongoliaMontenegroMoroccoMozambiqueMyanmarNamibiaNepalNetherlandsNew ZealandNicaraguaNigerNigeriaNorth AmericaNorwayOECD membersOmanOther small statesPakistanPanamaParaguayPeruPhilippinesPolandPortugalPost-demographic dividendPre-demographic dividendQatarRomaniaRussian FederationSaudi ArabiaSenegalSerbiaSingaporeSlovak RepublicSloveniaSmall statesSouth AfricaSouth AsiaSouth Asia (IDA & IBRD)South SudanSpainSri LankaSub-Saharan Africa Sub-Saharan Africa (excluding high income)Sub-Saharan Africa (IDA & IBRD countries)SudanSwedenSwitzerlandSyrian Arab RepublicTajikistanTanzaniaThailandTogoTrinidad and TobagoTunisiaTurkeyTurkmenistanUkraineUnited Arab EmiratesUnited KingdomUnited StatesUpper middle incomeUruguayUzbekistanVenezuela, RBVietnamWorldYemen, Rep.ZambiaZimbabwe La ligne de temps
Cette échelle de temps montre un graphique de 1972 année à 2014 année Sub-Saharan Africa (excluding high income). Les données jusqu'à 1971 année ne sont pas présentés. Quantité d'observations actuelles selon dates: 43.
Source (désignation):
Les indicateurs du développement mondiale
Source (organisation):
IEA Statistics © OECD/IEA 2014 (http://www.iea.org/stats/index.asp), subject to https://www.iea.org/t&c/termsandconditions/
Catégories:
Environment
Dernière mise à jour
23 avr. 2017
Les indicateurs de changement de valeurs selon les années
Minimum:
1.801
1 janv. 2005
Maximum:
3.917
1 janv. 2013
Pour la date d''observation
Valeur
Changement absolu
Le changement par rapport à la valeur précédente
1 janv. 1972
3.759
+3.759
0.0%
1 janv. 1973
3.685
-0.074
-1.98%
1 janv. 1974
3.513
-0.172
-4.66%
1 janv. 1975
3.538
+0.025
0.71%
1 janv. 1976
3.293
-0.245
-6.93%
1 janv. 1977
3.192
-0.101
-3.07%
1 janv. 1978
3.339
+0.147
4.59%
1 janv. 1979
3.588
+0.249
7.47%
1 janv. 1980
3.086
-0.502
-13.98%
1 janv. 1981
3.083
-0.003
-0.1%
1 janv. 1982
2.868
-0.215
-6.99%
1 janv. 1983
2.623
-0.245
-8.56%
1 janv. 1984
2.791
+0.168
6.41%
1 janv. 1985
2.477
-0.313
-11.23%
1 janv. 1986
2.567
+0.09
3.65%
1 janv. 1987
2.277
-0.29
-11.31%
1 janv. 1988
2.582
+0.305
13.37%
1 janv. 1989
2.534
-0.048
-1.86%
1 janv. 1990
2.534
+0.001
0.03%
1 janv. 1991
2.145
-0.39
-15.38%
1 janv. 1992
2.265
+0.12
5.62%
1 janv. 1993
2.167
-0.098
-4.31%
1 janv. 1994
2.764
+0.596
27.52%
1 janv. 1995
2.887
+0.123
4.47%
1 janv. 1996
3.046
+0.159
5.49%
1 janv. 1997
2.87
-0.176
-5.77%
1 janv. 1998
2.537
-0.333
-11.6%
1 janv. 1999
3.044
+0.507
19.97%
1 janv. 2000
2.904
-0.14
-4.61%
1 janv. 2001
2.741
-0.163
-5.61%
1 janv. 2002
2.285
-0.456
-16.63%
1 janv. 2003
2.059
-0.225
-9.86%
1 janv. 2004
1.898
-0.161
-7.83%
1 janv. 2005
1.801
-0.097
-5.11%
1 janv. 2006
1.872
+0.071
3.93%
1 janv. 2007
2.352
+0.48
25.62%
1 janv. 2008
2.502
+0.15
6.39%
1 janv. 2009
2.17
-0.331
-13.25%
1 janv. 2010
1.91
-0.26
-11.99%
1 janv. 2011
2.914
+1.004
52.59%
1 janv. 2012
3.421
+0.506
17.38%
1 janv. 2013
3.917
+0.496
14.51%
1 janv. 2014
3.878
-0.04
-1.01%
Classement des pays selon les statistiques actuelles par années


Commentaires: