29
/fr/
fr
AIzaSyAYiBZKx7MnpbEhh9jyipgxe19OcubqV5w
April 1, 2024
106991
Colombia
COL
true
2
1
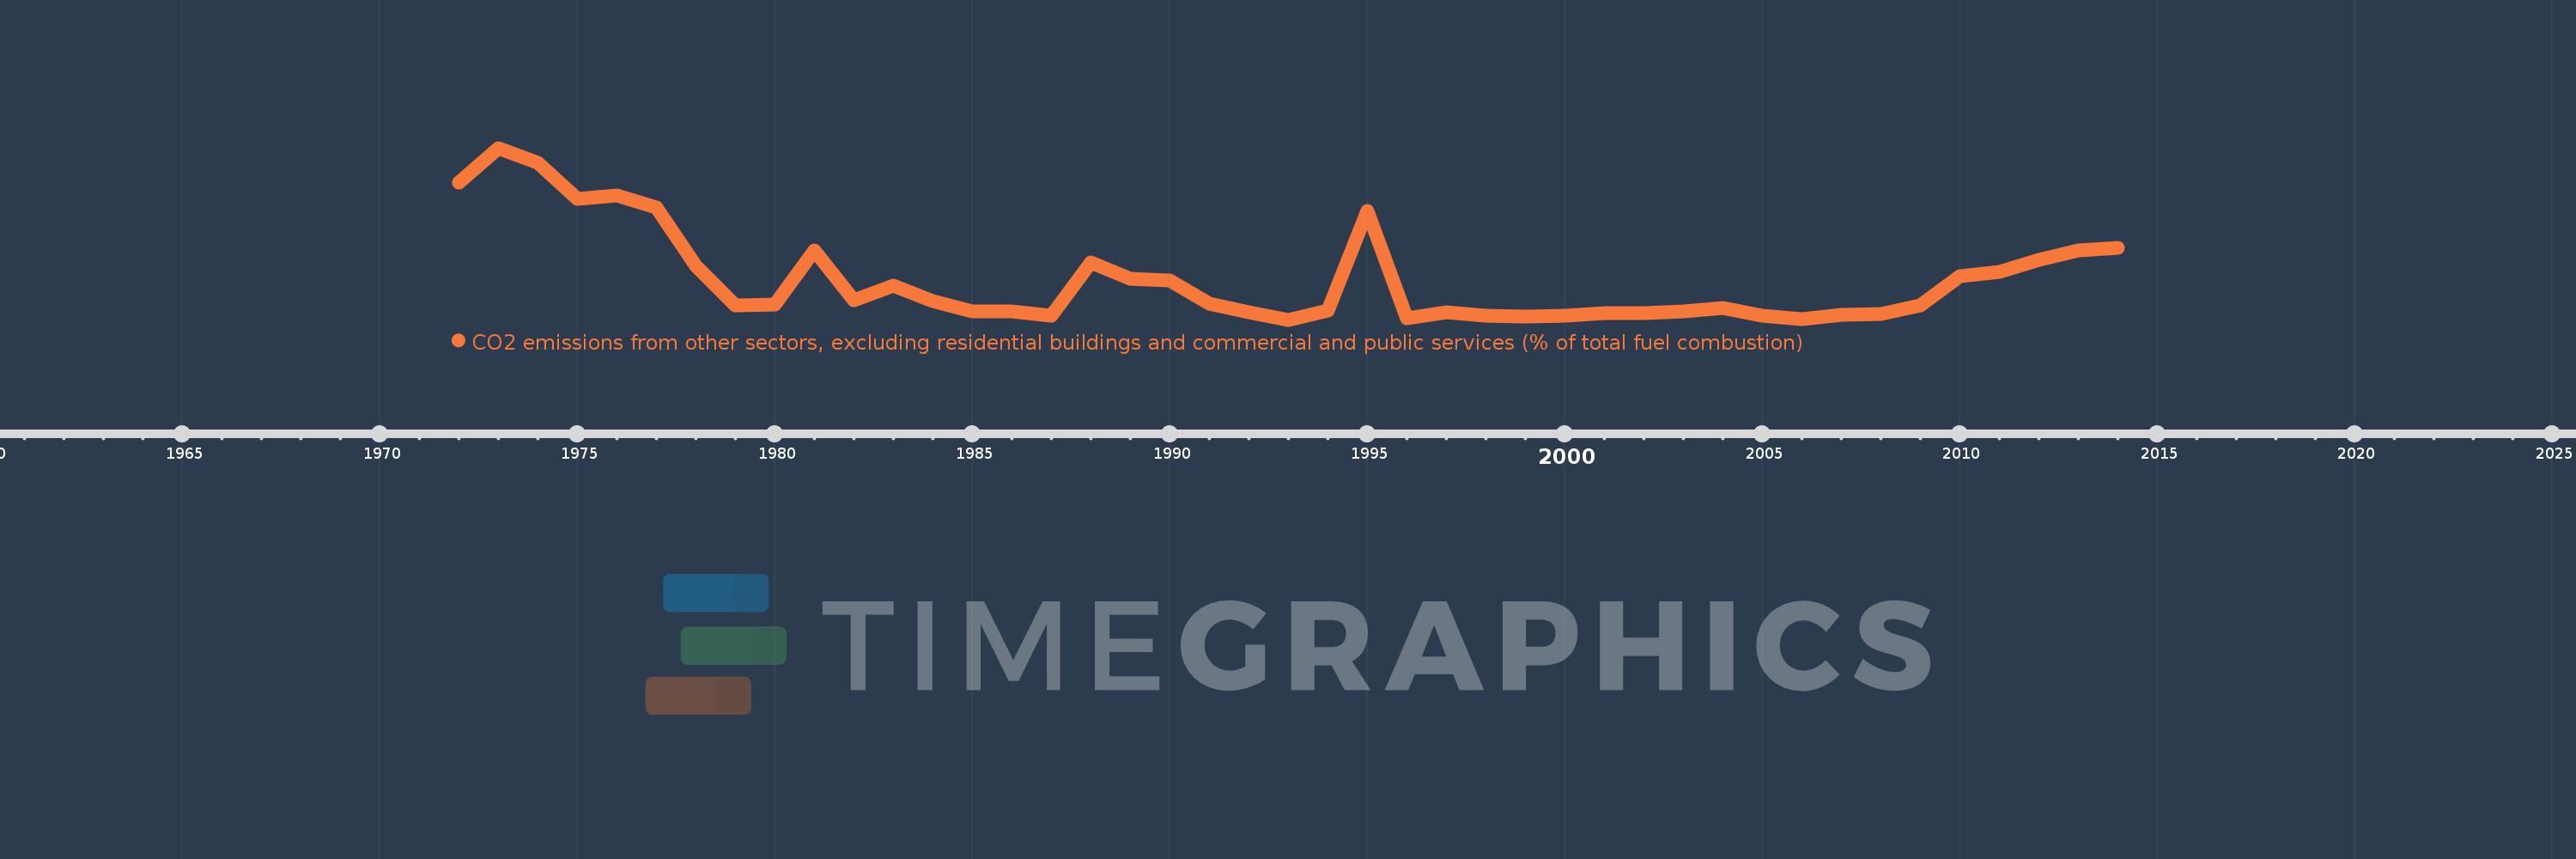
CO2 emissions from other sectors, excluding residential buildings and commercial and public services (% of total fuel combustion)
2014,2013,2012,2011,2010,2009,2008,2007,2006,2005,2004,2003,2002,2001,2000,1999,1998,1997,1996,1995,1994,1993,1992,1991,1990,1989,1988,1987,1986,1985,1984,1983,1982,1981,1980,1979,1978,1977,1976,1975,1974,1973,1972
Cette statistique dans les autres pays:
AlbaniaAlgeriaAngolaArab WorldArgentinaArmeniaAustraliaAustriaAzerbaijanBahrainBangladeshBelarusBelgiumBeninBoliviaBosnia and HerzegovinaBotswanaBrazilBrunei DarussalamBulgariaCambodiaCameroonCanadaCaribbean small statesCentral Europe and the BalticsChileChinaColombiaCongo, Dem. Rep.Congo, Rep.Costa RicaCote d'IvoireCroatiaCubaCuracaoCyprusCzech RepublicDenmarkDominican RepublicEarly-demographic dividendEast Asia & PacificEast Asia & Pacific (excluding high income)East Asia & Pacific (IDA & IBRD countries)EcuadorEgypt, Arab Rep.El SalvadorEritreaEstoniaEthiopiaEuro areaEurope & Central AsiaEurope & Central Asia (excluding high income)Europe & Central Asia (IDA & IBRD countries)European UnionFinlandFragile and conflict affected situationsFranceGabonGeorgiaGermanyGhanaGibraltarGreeceGuatemalaHaitiHeavily indebted poor countries (HIPC)High incomeHondurasHong Kong SAR, ChinaHungaryIBRD onlyIcelandIDA & IBRD totalIDA blendIDA onlyIDA totalIndiaIndonesiaIran, Islamic Rep.IraqIrelandIsraelItalyJamaicaJapanJordanKazakhstanKenyaKorea, Dem. People’s Rep.Korea, Rep.KosovoKuwaitKyrgyz RepublicLate-demographic dividendLatin America & Caribbean Latin America & Caribbean (excluding high income)Latin America & the Caribbean (IDA & IBRD countries)LatviaLeast developed countries: UN classificationLebanonLibyaLithuaniaLow & middle incomeLow incomeLower middle incomeLuxembourgMacedonia, FYRMalaysiaMaltaMauritiusMexicoMiddle East & North AfricaMiddle East & North Africa (excluding high income)Middle East & North Africa (IDA & IBRD countries)Middle incomeMoldovaMongoliaMontenegroMoroccoMozambiqueMyanmarNamibiaNepalNetherlandsNew ZealandNicaraguaNigerNigeriaNorth AmericaNorwayOECD membersOmanOther small statesPakistanPanamaParaguayPeruPhilippinesPolandPortugalPost-demographic dividendPre-demographic dividendQatarRomaniaRussian FederationSaudi ArabiaSenegalSerbiaSingaporeSlovak RepublicSloveniaSmall statesSouth AfricaSouth AsiaSouth Asia (IDA & IBRD)South SudanSpainSri LankaSub-Saharan Africa Sub-Saharan Africa (excluding high income)Sub-Saharan Africa (IDA & IBRD countries)SudanSwedenSwitzerlandSyrian Arab RepublicTajikistanTanzaniaThailandTogoTrinidad and TobagoTunisiaTurkeyTurkmenistanUkraineUnited Arab EmiratesUnited KingdomUnited StatesUpper middle incomeUruguayUzbekistanVenezuela, RBVietnamWorldYemen, Rep.ZambiaZimbabwe La ligne de temps
Cette échelle de temps montre un graphique de 1972 année à 2014 année Colombia. Les données jusqu'à 1971 année ne sont pas présentés. Quantité d'observations actuelles selon dates: 43.
Source (désignation):
Les indicateurs du développement mondiale
Source (organisation):
IEA Statistics © OECD/IEA 2014 (http://www.iea.org/stats/index.asp), subject to https://www.iea.org/t&c/termsandconditions/
Catégories:
Environment
Dernière mise à jour
23 avr. 2017
Les indicateurs de changement de valeurs selon les années
Minimum:
2.427
1 janv. 1993
Maximum:
10.212
1 janv. 1973
Pour la date d''observation
Valeur
Changement absolu
Le changement par rapport à la valeur précédente
1 janv. 1972
8.661
+8.661
0.0%
1 janv. 1973
10.212
+1.551
17.91%
1 janv. 1974
9.525
-0.687
-6.73%
1 janv. 1975
7.887
-1.638
-17.2%
1 janv. 1976
8.059
+0.172
2.19%
1 janv. 1977
7.528
-0.531
-6.59%
1 janv. 1978
4.868
-2.66
-35.34%
1 janv. 1979
3.06
-1.808
-37.14%
1 janv. 1980
3.117
+0.057
1.86%
1 janv. 1981
5.575
+2.458
78.87%
1 janv. 1982
3.321
-2.254
-40.43%
1 janv. 1983
3.973
+0.652
19.63%
1 janv. 1984
3.266
-0.707
-17.81%
1 janv. 1985
2.805
-0.461
-14.1%
1 janv. 1986
2.787
-0.018
-0.64%
1 janv. 1987
2.615
-0.172
-6.19%
1 janv. 1988
5.022
+2.408
92.09%
1 janv. 1989
4.271
-0.751
-14.96%
1 janv. 1990
4.216
-0.055
-1.29%
1 janv. 1991
3.145
-1.07
-25.39%
1 janv. 1992
2.778
-0.368
-11.69%
1 janv. 1993
2.427
-0.351
-12.64%
1 janv. 1994
2.839
+0.412
16.99%
1 janv. 1995
7.361
+4.521
159.26%
1 janv. 1996
2.479
-4.881
-66.32%
1 janv. 1997
2.778
+0.298
12.04%
1 janv. 1998
2.597
-0.181
-6.52%
1 janv. 1999
2.562
-0.035
-1.36%
1 janv. 2000
2.615
+0.053
2.08%
1 janv. 2001
2.714
+0.099
3.78%
1 janv. 2002
2.709
-0.005
-0.17%
1 janv. 2003
2.819
+0.109
4.04%
1 janv. 2004
2.951
+0.133
4.71%
1 janv. 2005
2.598
-0.354
-11.99%
1 janv. 2006
2.445
-0.152
-5.86%
1 janv. 2007
2.665
+0.22
9.0%
1 janv. 2008
2.703
+0.037
1.4%
1 janv. 2009
3.092
+0.39
14.42%
1 janv. 2010
4.405
+1.312
42.43%
1 janv. 2011
4.584
+0.179
4.07%
1 janv. 2012
5.154
+0.57
12.43%
1 janv. 2013
5.554
+0.4
7.76%
1 janv. 2014
5.677
+0.124
2.23%
Classement des pays selon les statistiques actuelles par années


Commentaires: