29
/fr/
fr
AIzaSyAYiBZKx7MnpbEhh9jyipgxe19OcubqV5w
April 1, 2024
59113
Sub-Saharan Africa
SSF
false
2
1
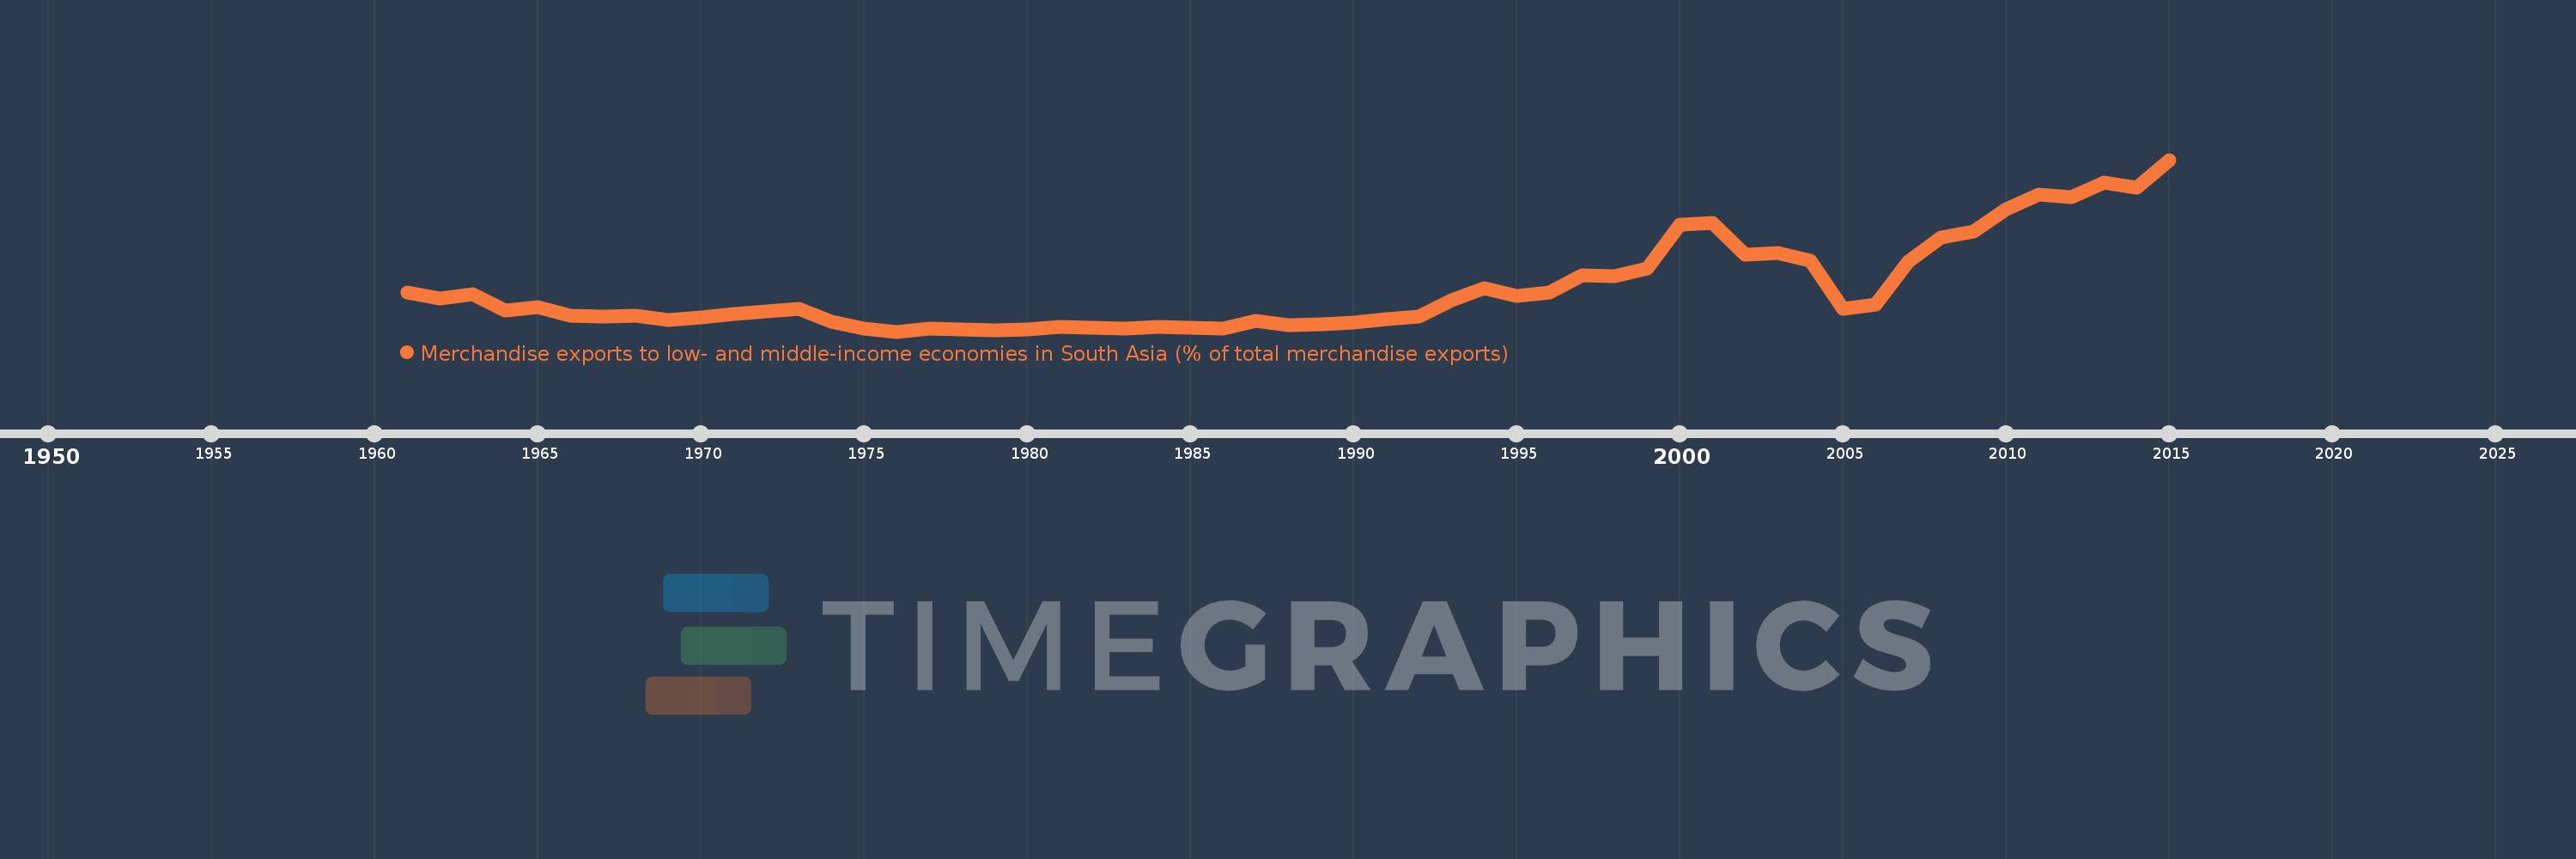
Merchandise exports to low- and middle-income economies in South Asia (% of total merchandise exports)
2015,2014,2013,2012,2011,2010,2009,2008,2007,2006,2005,2004,2003,2002,2001,2000,1999,1998,1997,1996,1995,1994,1993,1992,1991,1990,1989,1988,1987,1986,1985,1984,1983,1982,1981,1980,1979,1978,1977,1976,1975,1974,1973,1972,1971,1970,1969,1968,1967,1966,1965,1964,1963,1962,1961
Cette statistique dans les autres pays:
AfghanistanAlbaniaAlgeriaAngolaAntigua and BarbudaArab WorldArgentinaArmeniaArubaAustraliaAustriaAzerbaijanBahamas, TheBahrainBangladeshBarbadosBelarusBelgiumBelizeBeninBermudaBoliviaBrazilBrunei DarussalamBulgariaBurkina FasoBurundiCabo VerdeCambodiaCameroonCanadaCaribbean small statesCentral African RepublicCentral Europe and the BalticsChadChileChinaColombiaCongo, Rep.Costa RicaCote d'IvoireCroatiaCyprusCzech RepublicDenmarkDjiboutiDominicaDominican RepublicEarly-demographic dividendEast Asia & PacificEast Asia & Pacific (excluding high income)East Asia & Pacific (IDA & IBRD countries)EcuadorEgypt, Arab Rep.El SalvadorEstoniaEthiopiaEuro areaEurope & Central AsiaEurope & Central Asia (excluding high income)Europe & Central Asia (IDA & IBRD countries)European UnionFaroe IslandsFijiFinlandFragile and conflict affected situationsFranceGabonGambia, TheGeorgiaGermanyGhanaGibraltarGreeceGreenlandGrenadaGuatemalaGuineaGuyanaHaitiHeavily indebted poor countries (HIPC)High incomeHondurasHong Kong SAR, ChinaHungaryIBRD onlyIcelandIDA & IBRD totalIDA blendIDA onlyIDA totalIndiaIndonesiaIran, Islamic Rep.IraqIrelandIsraelItalyJamaicaJapanJordanKazakhstanKenyaKiribatiKorea, Dem. People’s Rep.Korea, Rep.KosovoKuwaitKyrgyz RepublicLao PDRLate-demographic dividendLatin America & Caribbean Latin America & Caribbean (excluding high income)Latin America & the Caribbean (IDA & IBRD countries)LatviaLeast developed countries: UN classificationLebanonLiberiaLibyaLithuaniaLow & middle incomeLow incomeLower middle incomeLuxembourgMacao SAR, ChinaMacedonia, FYRMadagascarMalawiMalaysiaMaldivesMaliMaltaMauritaniaMauritiusMexicoMiddle East & North AfricaMiddle East & North Africa (excluding high income)Middle East & North Africa (IDA & IBRD countries)Middle incomeMoldovaMongoliaMontenegroMoroccoMozambiqueMyanmarNauruNepalNetherlandsNew CaledoniaNew ZealandNicaraguaNigerNigeriaNorth AmericaNorwayOECD membersOmanOther small statesPacific island small statesPakistanPanamaPapua New GuineaParaguayPeruPhilippinesPolandPortugalPost-demographic dividendPre-demographic dividendQatarRomaniaRussian FederationRwandaSamoaSaudi ArabiaSenegalSerbiaSeychellesSierra LeoneSingaporeSlovak RepublicSloveniaSmall statesSomaliaSouth AfricaSouth AsiaSouth Asia (IDA & IBRD)SpainSri LankaSt. LuciaSt. Vincent and the GrenadinesSub-Saharan Africa Sub-Saharan Africa (excluding high income)Sub-Saharan Africa (IDA & IBRD countries)SudanSurinameSwedenSwitzerlandSyrian Arab RepublicTajikistanTanzaniaThailandTogoTongaTrinidad and TobagoTunisiaTurkeyTurkmenistanUgandaUkraineUnited Arab EmiratesUnited KingdomUnited StatesUpper middle incomeUruguayVanuatuVenezuela, RBVietnamWorldYemen, Rep.ZambiaZimbabwe La ligne de temps
Cette échelle de temps montre un graphique de 1961 année à 2015 année Sub-Saharan Africa . Les données jusqu'à 1960 année ne sont pas présentés. Quantité d'observations actuelles selon dates: 55.
Source (désignation):
Les indicateurs du développement mondiale
Source (organisation):
World Bank staff estimates based data from International Monetary Fund's Direction of Trade database.
Catégories:
Private Sector, Trade
Dernière mise à jour
23 avr. 2017
Les indicateurs de changement de valeurs selon les années
Minimum:
0.322
1 janv. 1976
Maximum:
8.156
1 janv. 2015
Pour la date d''observation
Valeur
Changement absolu
Le changement par rapport à la valeur précédente
1 janv. 1961
2.115
+2.115
0.0%
1 janv. 1962
1.845
-0.27
-12.75%
1 janv. 1963
2.043
+0.198
10.71%
1 janv. 1964
1.291
-0.752
-36.81%
1 janv. 1965
1.437
+0.147
11.35%
1 janv. 1966
1.049
-0.389
-27.05%
1 janv. 1967
1.003
-0.045
-4.33%
1 janv. 1968
1.059
+0.056
5.55%
1 janv. 1969
0.857
-0.202
-19.03%
1 janv. 1970
0.967
+0.109
12.75%
1 janv. 1971
1.131
+0.164
16.99%
1 janv. 1972
1.223
+0.092
8.16%
1 janv. 1973
1.367
+0.144
11.76%
1 janv. 1974
0.771
-0.596
-43.62%
1 janv. 1975
0.472
-0.299
-38.81%
1 janv. 1976
0.322
-0.15
-31.76%
1 janv. 1977
0.464
+0.143
44.29%
1 janv. 1978
0.412
-0.052
-11.19%
1 janv. 1979
0.398
-0.014
-3.39%
1 janv. 1980
0.405
+0.007
1.76%
1 janv. 1981
0.54
+0.135
33.29%
1 janv. 1982
0.505
-0.035
-6.55%
1 janv. 1983
0.45
-0.055
-10.82%
1 janv. 1984
0.537
+0.087
19.25%
1 janv. 1985
0.512
-0.026
-4.76%
1 janv. 1986
0.442
-0.07
-13.6%
1 janv. 1987
0.83
+0.388
87.8%
1 janv. 1988
0.634
-0.196
-23.63%
1 janv. 1989
0.671
+0.037
5.83%
1 janv. 1990
0.719
+0.048
7.13%
1 janv. 1991
0.889
+0.17
23.64%
1 janv. 1992
1.007
+0.119
13.38%
1 janv. 1993
1.757
+0.749
74.36%
1 janv. 1994
2.305
+0.548
31.19%
1 janv. 1995
1.937
-0.368
-15.97%
1 janv. 1996
2.097
+0.161
8.3%
1 janv. 1997
2.874
+0.777
37.04%
1 janv. 1998
2.829
-0.045
-1.57%
1 janv. 1999
3.192
+0.363
12.84%
1 janv. 2000
5.2
+2.008
62.91%
1 janv. 2001
5.295
+0.095
1.83%
1 janv. 2002
3.834
-1.461
-27.59%
1 janv. 2003
3.893
+0.059
1.53%
1 janv. 2004
3.557
-0.336
-8.63%
1 janv. 2005
1.375
-2.182
-61.33%
1 janv. 2006
1.575
+0.199
14.5%
1 janv. 2007
3.526
+1.951
123.88%
1 janv. 2008
4.599
+1.073
30.43%
1 janv. 2009
4.884
+0.285
6.2%
1 janv. 2010
5.912
+1.029
21.06%
1 janv. 2011
6.557
+0.645
10.91%
1 janv. 2012
6.464
-0.093
-1.42%
1 janv. 2013
7.131
+0.667
10.33%
1 janv. 2014
6.871
-0.26
-3.65%
1 janv. 2015
8.156
+1.284
18.69%
Classement des pays selon les statistiques actuelles par années


Commentaires: