29
/fr/
fr
AIzaSyAYiBZKx7MnpbEhh9jyipgxe19OcubqV5w
April 1, 2024
52810
OECD members
OED
false
2
1
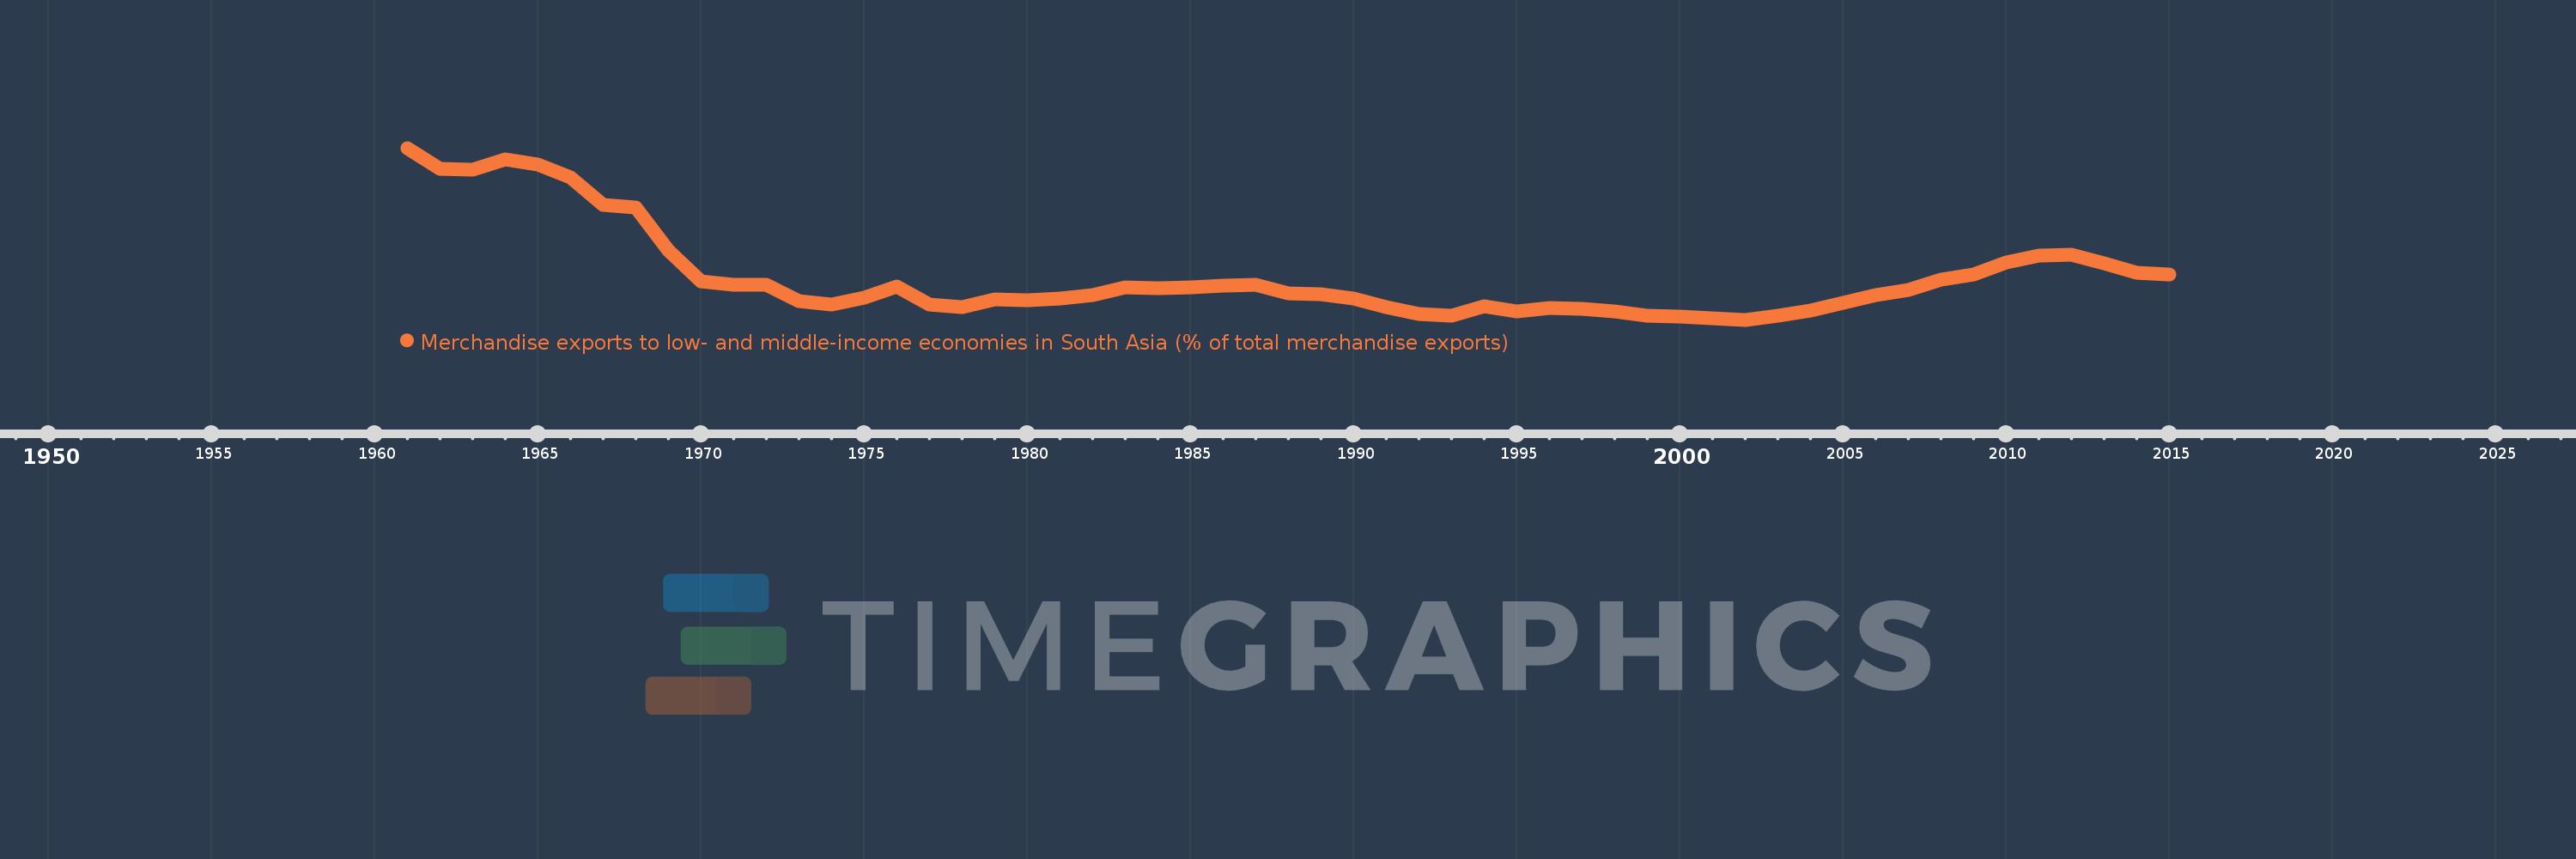
Merchandise exports to low- and middle-income economies in South Asia (% of total merchandise exports)
2015,2014,2013,2012,2011,2010,2009,2008,2007,2006,2005,2004,2003,2002,2001,2000,1999,1998,1997,1996,1995,1994,1993,1992,1991,1990,1989,1988,1987,1986,1985,1984,1983,1982,1981,1980,1979,1978,1977,1976,1975,1974,1973,1972,1971,1970,1969,1968,1967,1966,1965,1964,1963,1962,1961
Cette statistique dans les autres pays:
AfghanistanAlbaniaAlgeriaAngolaAntigua and BarbudaArab WorldArgentinaArmeniaArubaAustraliaAustriaAzerbaijanBahamas, TheBahrainBangladeshBarbadosBelarusBelgiumBelizeBeninBermudaBoliviaBrazilBrunei DarussalamBulgariaBurkina FasoBurundiCabo VerdeCambodiaCameroonCanadaCaribbean small statesCentral African RepublicCentral Europe and the BalticsChadChileChinaColombiaCongo, Rep.Costa RicaCote d'IvoireCroatiaCyprusCzech RepublicDenmarkDjiboutiDominicaDominican RepublicEarly-demographic dividendEast Asia & PacificEast Asia & Pacific (excluding high income)East Asia & Pacific (IDA & IBRD countries)EcuadorEgypt, Arab Rep.El SalvadorEstoniaEthiopiaEuro areaEurope & Central AsiaEurope & Central Asia (excluding high income)Europe & Central Asia (IDA & IBRD countries)European UnionFaroe IslandsFijiFinlandFragile and conflict affected situationsFranceGabonGambia, TheGeorgiaGermanyGhanaGibraltarGreeceGreenlandGrenadaGuatemalaGuineaGuyanaHaitiHeavily indebted poor countries (HIPC)High incomeHondurasHong Kong SAR, ChinaHungaryIBRD onlyIcelandIDA & IBRD totalIDA blendIDA onlyIDA totalIndiaIndonesiaIran, Islamic Rep.IraqIrelandIsraelItalyJamaicaJapanJordanKazakhstanKenyaKiribatiKorea, Dem. People’s Rep.Korea, Rep.KosovoKuwaitKyrgyz RepublicLao PDRLate-demographic dividendLatin America & Caribbean Latin America & Caribbean (excluding high income)Latin America & the Caribbean (IDA & IBRD countries)LatviaLeast developed countries: UN classificationLebanonLiberiaLibyaLithuaniaLow & middle incomeLow incomeLower middle incomeLuxembourgMacao SAR, ChinaMacedonia, FYRMadagascarMalawiMalaysiaMaldivesMaliMaltaMauritaniaMauritiusMexicoMiddle East & North AfricaMiddle East & North Africa (excluding high income)Middle East & North Africa (IDA & IBRD countries)Middle incomeMoldovaMongoliaMontenegroMoroccoMozambiqueMyanmarNauruNepalNetherlandsNew CaledoniaNew ZealandNicaraguaNigerNigeriaNorth AmericaNorwayOECD membersOmanOther small statesPacific island small statesPakistanPanamaPapua New GuineaParaguayPeruPhilippinesPolandPortugalPost-demographic dividendPre-demographic dividendQatarRomaniaRussian FederationRwandaSamoaSaudi ArabiaSenegalSerbiaSeychellesSierra LeoneSingaporeSlovak RepublicSloveniaSmall statesSomaliaSouth AfricaSouth AsiaSouth Asia (IDA & IBRD)SpainSri LankaSt. LuciaSt. Vincent and the GrenadinesSub-Saharan Africa Sub-Saharan Africa (excluding high income)Sub-Saharan Africa (IDA & IBRD countries)SudanSurinameSwedenSwitzerlandSyrian Arab RepublicTajikistanTanzaniaThailandTogoTongaTrinidad and TobagoTunisiaTurkeyTurkmenistanUgandaUkraineUnited Arab EmiratesUnited KingdomUnited StatesUpper middle incomeUruguayVanuatuVenezuela, RBVietnamWorldYemen, Rep.ZambiaZimbabwe La ligne de temps
Cette échelle de temps montre un graphique de 1961 année à 2015 année OECD members. Les données jusqu'à 1960 année ne sont pas présentés. Quantité d'observations actuelles selon dates: 55.
Source (désignation):
Les indicateurs du développement mondiale
Source (organisation):
World Bank staff estimates based data from International Monetary Fund's Direction of Trade database.
Catégories:
Private Sector, Trade
Dernière mise à jour
23 avr. 2017
Les indicateurs de changement de valeurs selon les années
Minimum:
0.676
1 janv. 2002
Maximum:
2.909
1 janv. 1961
Pour la date d''observation
Valeur
Changement absolu
Le changement par rapport à la valeur précédente
1 janv. 1961
2.909
+2.909
0.0%
1 janv. 1962
2.636
-0.273
-9.38%
1 janv. 1963
2.627
-0.009
-0.34%
1 janv. 1964
2.76
+0.133
5.07%
1 janv. 1965
2.688
-0.072
-2.62%
1 janv. 1966
2.524
-0.164
-6.09%
1 janv. 1967
2.172
-0.353
-13.97%
1 janv. 1968
2.138
-0.033
-1.53%
1 janv. 1969
1.576
-0.562
-26.3%
1 janv. 1970
1.17
-0.406
-25.76%
1 janv. 1971
1.129
-0.041
-3.48%
1 janv. 1972
1.131
+0.001
0.12%
1 janv. 1973
0.922
-0.208
-18.41%
1 janv. 1974
0.87
-0.053
-5.72%
1 janv. 1975
0.968
+0.098
11.25%
1 janv. 1976
1.111
+0.144
14.85%
1 janv. 1977
0.879
-0.232
-20.92%
1 janv. 1978
0.837
-0.042
-4.75%
1 janv. 1979
0.936
+0.099
11.78%
1 janv. 1980
0.931
-0.005
-0.52%
1 janv. 1981
0.955
+0.024
2.62%
1 janv. 1982
0.996
+0.041
4.31%
1 janv. 1983
1.102
+0.106
10.6%
1 janv. 1984
1.091
-0.01
-0.95%
1 janv. 1985
1.095
+0.004
0.33%
1 janv. 1986
1.119
+0.024
2.17%
1 janv. 1987
1.131
+0.012
1.06%
1 janv. 1988
1.019
-0.111
-9.85%
1 janv. 1989
1.011
-0.008
-0.81%
1 janv. 1990
0.953
-0.059
-5.8%
1 janv. 1991
0.84
-0.112
-11.79%
1 janv. 1992
0.753
-0.087
-10.34%
1 janv. 1993
0.726
-0.028
-3.68%
1 janv. 1994
0.854
+0.128
17.66%
1 janv. 1995
0.787
-0.067
-7.81%
1 janv. 1996
0.827
+0.039
5.0%
1 janv. 1997
0.815
-0.012
-1.43%
1 janv. 1998
0.789
-0.026
-3.2%
1 janv. 1999
0.726
-0.063
-8.0%
1 janv. 2000
0.716
-0.01
-1.35%
1 janv. 2001
0.696
-0.02
-2.79%
1 janv. 2002
0.676
-0.02
-2.85%
1 janv. 2003
0.728
+0.052
7.71%
1 janv. 2004
0.801
+0.073
9.97%
1 janv. 2005
0.901
+0.1
12.48%
1 janv. 2006
0.997
+0.096
10.69%
1 janv. 2007
1.063
+0.066
6.65%
1 janv. 2008
1.196
+0.132
12.46%
1 janv. 2009
1.261
+0.065
5.43%
1 janv. 2010
1.42
+0.159
12.63%
1 janv. 2011
1.505
+0.085
6.0%
1 janv. 2012
1.516
+0.011
0.7%
1 janv. 2013
1.413
-0.103
-6.8%
1 janv. 2014
1.288
-0.124
-8.79%
1 janv. 2015
1.264
-0.025
-1.91%
Classement des pays selon les statistiques actuelles par années


Commentaires: