29
/fr/
fr
AIzaSyAYiBZKx7MnpbEhh9jyipgxe19OcubqV5w
April 1, 2024
58117
South Asia (IDA & IBRD)
TSA
false
2
1
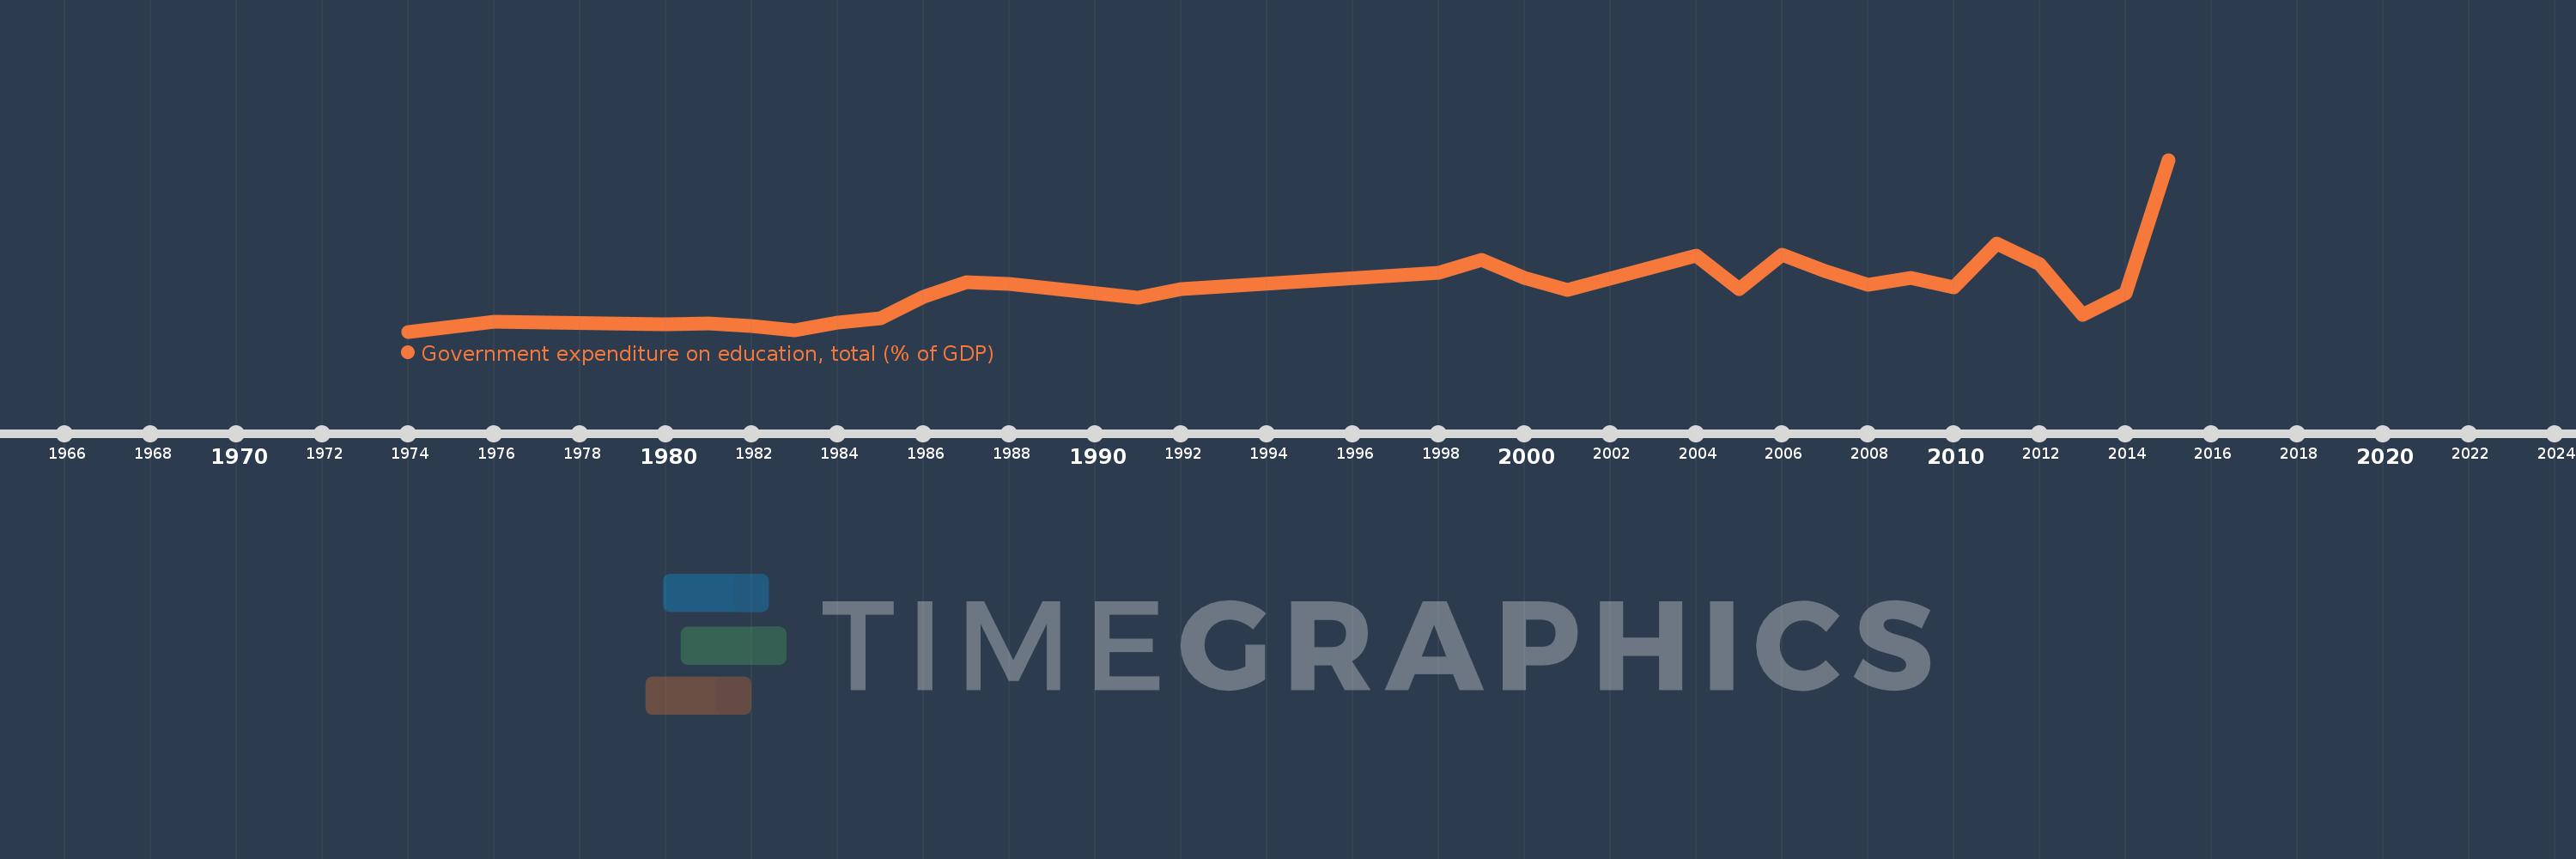
Government expenditure on education, total (% of GDP)
2015,2014,2013,2012,2011,2010,2009,2008,2007,2006,2005,2004,2001,2000,1999,1998,1992,1991,1988,1987,1986,1985,1984,1983,1982,1981,1980,1976,1974
Cette statistique dans les autres pays:
AfghanistanAlbaniaAlgeriaAndorraAngolaAntigua and BarbudaArab WorldArgentinaArmeniaArubaAustraliaAustriaAzerbaijanBahamas, TheBahrainBangladeshBarbadosBelarusBelgiumBelizeBeninBermudaBhutanBoliviaBotswanaBrazilBritish Virgin IslandsBrunei DarussalamBulgariaBurkina FasoBurundiCabo VerdeCambodiaCameroonCanadaCaribbean small statesCentral African RepublicCentral Europe and the BalticsChadChileChinaColombiaComorosCongo, Dem. Rep.Congo, Rep.Costa RicaCote d'IvoireCroatiaCubaCuracaoCyprusCzech RepublicDenmarkDjiboutiDominicaDominican RepublicEarly-demographic dividendEast Asia & PacificEast Asia & Pacific (excluding high income)East Asia & Pacific (IDA & IBRD countries)EcuadorEgypt, Arab Rep.El SalvadorEquatorial GuineaEritreaEstoniaEthiopiaEuro areaEurope & Central AsiaEurope & Central Asia (excluding high income)Europe & Central Asia (IDA & IBRD countries)European UnionFijiFinlandFranceGabonGambia, TheGeorgiaGermanyGhanaGreeceGrenadaGuatemalaGuineaGuinea-BissauGuyanaHaitiHeavily indebted poor countries (HIPC)High incomeHondurasHong Kong SAR, ChinaHungaryIBRD onlyIcelandIDA & IBRD totalIDA blendIDA onlyIDA totalIndiaIndonesiaIran, Islamic Rep.IraqIrelandIsraelItalyJamaicaJapanJordanKazakhstanKenyaKiribatiKorea, Rep.KuwaitKyrgyz RepublicLao PDRLate-demographic dividendLatin America & Caribbean Latin America & Caribbean (excluding high income)Latin America & the Caribbean (IDA & IBRD countries)LatviaLeast developed countries: UN classificationLebanonLesothoLiberiaLibyaLiechtensteinLithuaniaLow & middle incomeLow incomeLower middle incomeLuxembourgMacao SAR, ChinaMacedonia, FYRMadagascarMalawiMalaysiaMaldivesMaliMaltaMarshall IslandsMauritaniaMauritiusMexicoMicronesia, Fed. Sts.Middle East & North AfricaMiddle East & North Africa (excluding high income)Middle East & North Africa (IDA & IBRD countries)Middle incomeMoldovaMonacoMongoliaMoroccoMozambiqueMyanmarNamibiaNepalNetherlandsNew ZealandNicaraguaNigerNigeriaNorth AmericaNorwayOECD membersOmanOther small statesPakistanPalauPanamaPapua New GuineaParaguayPeruPhilippinesPolandPortugalPost-demographic dividendPre-demographic dividendPuerto RicoQatarRomaniaRussian FederationRwandaSamoaSan MarinoSao Tome and PrincipeSaudi ArabiaSenegalSerbiaSeychellesSierra LeoneSingaporeSlovak RepublicSloveniaSmall statesSolomon IslandsSomaliaSouth AfricaSouth AsiaSouth Asia (IDA & IBRD)South SudanSpainSri LankaSt. Kitts and NevisSt. LuciaSt. Vincent and the GrenadinesSub-Saharan Africa Sub-Saharan Africa (excluding high income)Sub-Saharan Africa (IDA & IBRD countries)SudanSwazilandSwedenSwitzerlandSyrian Arab RepublicTajikistanTanzaniaThailandTimor-LesteTogoTongaTrinidad and TobagoTunisiaTurkeyTurkmenistanTurks and Caicos IslandsTuvaluUgandaUkraineUnited Arab EmiratesUnited KingdomUnited StatesUpper middle incomeUruguayVanuatuVenezuela, RBVietnamWorldYemen, Rep.ZambiaZimbabwe La ligne de temps
Cette échelle de temps montre un graphique de 1974 année à 2015 année South Asia (IDA & IBRD). Les données jusqu'à 1973 année ne sont pas présentés. Quantité d'observations actuelles selon dates: 29.
Source (désignation):
Les indicateurs du développement mondiale
Source (organisation):
United Nations Educational, Scientific, and Cultural Organization (UNESCO) Institute for Statistics.
Catégories:
Education
Dernière mise à jour
23 avr. 2017
Les indicateurs de changement de valeurs selon les années
Minimum:
1.851
1 janv. 1974
Maximum:
4.715
1 janv. 2015
Pour la date d''observation
Valeur
Changement absolu
Le changement par rapport à la valeur précédente
1 janv. 1974
1.851
+1.851
0.0%
1 janv. 1976
2.009
+0.157
8.5%
1 janv. 1980
1.968
-0.04
-2.0%
1 janv. 1981
1.985
+0.016
0.84%
1 janv. 1982
1.939
-0.046
-2.29%
1 janv. 1983
1.872
-0.068
-3.48%
1 janv. 1984
1.996
+0.124
6.62%
1 janv. 1985
2.07
+0.074
3.71%
1 janv. 1986
2.435
+0.366
17.66%
1 janv. 1987
2.678
+0.243
9.97%
1 janv. 1988
2.644
-0.034
-1.26%
1 janv. 1991
2.411
-0.233
-8.83%
1 janv. 1992
2.567
+0.156
6.46%
1 janv. 1998
2.828
+0.261
10.17%
1 janv. 1999
3.051
+0.224
7.9%
1 janv. 2000
2.752
-0.299
-9.8%
1 janv. 2001
2.55
-0.202
-7.35%
1 janv. 2004
3.114
+0.564
22.13%
1 janv. 2005
2.56
-0.554
-17.79%
1 janv. 2006
3.134
+0.574
22.41%
1 janv. 2007
2.859
-0.275
-8.78%
1 janv. 2008
2.635
-0.223
-7.81%
1 janv. 2009
2.746
+0.111
4.21%
1 janv. 2010
2.591
-0.155
-5.66%
1 janv. 2011
3.32
+0.729
28.13%
1 janv. 2012
2.972
-0.347
-10.46%
1 janv. 2013
2.136
-0.836
-28.13%
1 janv. 2014
2.493
+0.357
16.72%
1 janv. 2015
4.715
+2.222
89.11%
Classement des pays selon les statistiques actuelles par années


Commentaires: