29
/fr/
fr
AIzaSyAYiBZKx7MnpbEhh9jyipgxe19OcubqV5w
April 1, 2024
275726
United Kingdom
GBR
true
2
1
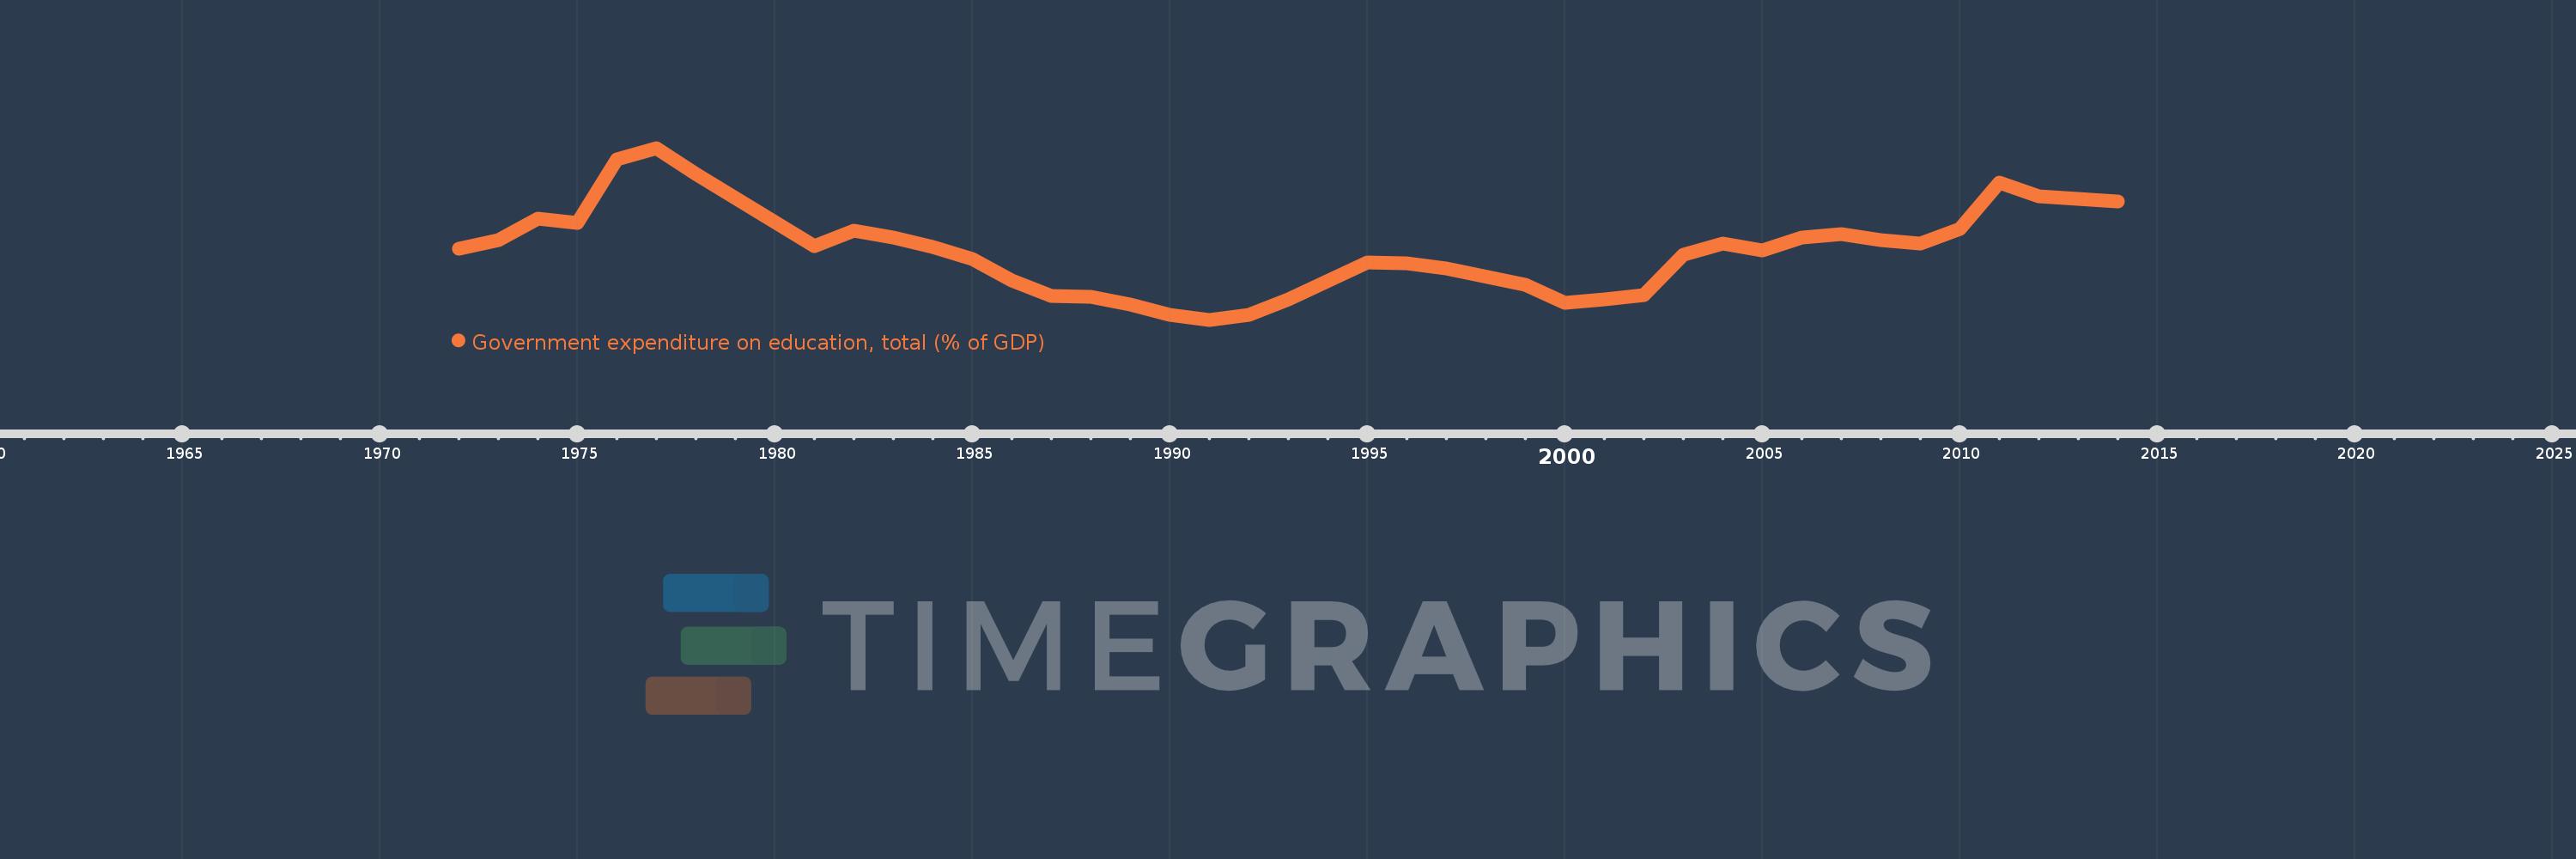
Government expenditure on education, total (% of GDP)
2014,2012,2011,2010,2009,2008,2007,2006,2005,2004,2003,2002,2001,2000,1999,1997,1996,1995,1993,1992,1991,1990,1989,1988,1987,1986,1985,1984,1983,1982,1981,1978,1977,1976,1975,1974,1973,1972
Cette statistique dans les autres pays:
AfghanistanAlbaniaAlgeriaAndorraAngolaAntigua and BarbudaArab WorldArgentinaArmeniaArubaAustraliaAustriaAzerbaijanBahamas, TheBahrainBangladeshBarbadosBelarusBelgiumBelizeBeninBermudaBhutanBoliviaBotswanaBrazilBritish Virgin IslandsBrunei DarussalamBulgariaBurkina FasoBurundiCabo VerdeCambodiaCameroonCanadaCaribbean small statesCentral African RepublicCentral Europe and the BalticsChadChileChinaColombiaComorosCongo, Dem. Rep.Congo, Rep.Costa RicaCote d'IvoireCroatiaCubaCuracaoCyprusCzech RepublicDenmarkDjiboutiDominicaDominican RepublicEarly-demographic dividendEast Asia & PacificEast Asia & Pacific (excluding high income)East Asia & Pacific (IDA & IBRD countries)EcuadorEgypt, Arab Rep.El SalvadorEquatorial GuineaEritreaEstoniaEthiopiaEuro areaEurope & Central AsiaEurope & Central Asia (excluding high income)Europe & Central Asia (IDA & IBRD countries)European UnionFijiFinlandFranceGabonGambia, TheGeorgiaGermanyGhanaGreeceGrenadaGuatemalaGuineaGuinea-BissauGuyanaHaitiHeavily indebted poor countries (HIPC)High incomeHondurasHong Kong SAR, ChinaHungaryIBRD onlyIcelandIDA & IBRD totalIDA blendIDA onlyIDA totalIndiaIndonesiaIran, Islamic Rep.IraqIrelandIsraelItalyJamaicaJapanJordanKazakhstanKenyaKiribatiKorea, Rep.KuwaitKyrgyz RepublicLao PDRLate-demographic dividendLatin America & Caribbean Latin America & Caribbean (excluding high income)Latin America & the Caribbean (IDA & IBRD countries)LatviaLeast developed countries: UN classificationLebanonLesothoLiberiaLibyaLiechtensteinLithuaniaLow & middle incomeLow incomeLower middle incomeLuxembourgMacao SAR, ChinaMacedonia, FYRMadagascarMalawiMalaysiaMaldivesMaliMaltaMarshall IslandsMauritaniaMauritiusMexicoMicronesia, Fed. Sts.Middle East & North AfricaMiddle East & North Africa (excluding high income)Middle East & North Africa (IDA & IBRD countries)Middle incomeMoldovaMonacoMongoliaMoroccoMozambiqueMyanmarNamibiaNepalNetherlandsNew ZealandNicaraguaNigerNigeriaNorth AmericaNorwayOECD membersOmanOther small statesPakistanPalauPanamaPapua New GuineaParaguayPeruPhilippinesPolandPortugalPost-demographic dividendPre-demographic dividendPuerto RicoQatarRomaniaRussian FederationRwandaSamoaSan MarinoSao Tome and PrincipeSaudi ArabiaSenegalSerbiaSeychellesSierra LeoneSingaporeSlovak RepublicSloveniaSmall statesSolomon IslandsSomaliaSouth AfricaSouth AsiaSouth Asia (IDA & IBRD)South SudanSpainSri LankaSt. Kitts and NevisSt. LuciaSt. Vincent and the GrenadinesSub-Saharan Africa Sub-Saharan Africa (excluding high income)Sub-Saharan Africa (IDA & IBRD countries)SudanSwazilandSwedenSwitzerlandSyrian Arab RepublicTajikistanTanzaniaThailandTimor-LesteTogoTongaTrinidad and TobagoTunisiaTurkeyTurkmenistanTurks and Caicos IslandsTuvaluUgandaUkraineUnited Arab EmiratesUnited KingdomUnited StatesUpper middle incomeUruguayVanuatuVenezuela, RBVietnamWorldYemen, Rep.ZambiaZimbabwe La ligne de temps
Cette échelle de temps montre un graphique de 1972 année à 2014 année United Kingdom. Les données jusqu'à 1971 année ne sont pas présentés. Quantité d'observations actuelles selon dates: 38.
Source (désignation):
Les indicateurs du développement mondiale
Source (organisation):
United Nations Educational, Scientific, and Cultural Organization (UNESCO) Institute for Statistics.
Catégories:
Education
Dernière mise à jour
23 avr. 2017
Les indicateurs de changement de valeurs selon les années
Minimum:
4.056
1 janv. 1991
Maximum:
6.424
1 janv. 1977
Pour la date d''observation
Valeur
Changement absolu
Le changement par rapport à la valeur précédente
1 janv. 1972
5.032
+5.032
0.0%
1 janv. 1973
5.159
+0.127
2.53%
1 janv. 1974
5.449
+0.289
5.61%
1 janv. 1975
5.391
-0.058
-1.06%
1 janv. 1976
6.269
+0.878
16.28%
1 janv. 1977
6.424
+0.155
2.48%
1 janv. 1978
6.063
-0.361
-5.62%
1 janv. 1981
5.07
-0.993
-16.38%
1 janv. 1982
5.288
+0.218
4.31%
1 janv. 1983
5.189
-0.1
-1.89%
1 janv. 1984
5.062
-0.127
-2.45%
1 janv. 1985
4.899
-0.162
-3.21%
1 janv. 1986
4.594
-0.305
-6.23%
1 janv. 1987
4.381
-0.213
-4.64%
1 janv. 1988
4.372
-0.009
-0.21%
1 janv. 1989
4.268
-0.103
-2.37%
1 janv. 1990
4.125
-0.143
-3.35%
1 janv. 1991
4.056
-0.07
-1.69%
1 janv. 1992
4.122
+0.067
1.65%
1 janv. 1993
4.334
+0.212
5.14%
1 janv. 1995
4.851
+0.516
11.91%
1 janv. 1996
4.839
-0.012
-0.24%
1 janv. 1997
4.763
-0.076
-1.57%
1 janv. 1999
4.54
-0.223
-4.69%
1 janv. 2000
4.291
-0.249
-5.49%
1 janv. 2001
4.332
+0.041
0.97%
1 janv. 2002
4.392
+0.06
1.38%
1 janv. 2003
4.954
+0.562
12.79%
1 janv. 2004
5.103
+0.149
3.0%
1 janv. 2005
5.007
-0.096
-1.87%
1 janv. 2006
5.195
+0.188
3.75%
1 janv. 2007
5.232
+0.037
0.71%
1 janv. 2008
5.153
-0.079
-1.5%
1 janv. 2009
5.109
-0.044
-0.85%
1 janv. 2010
5.309
+0.2
3.91%
1 janv. 2011
5.941
+0.631
11.89%
1 janv. 2012
5.762
-0.179
-3.01%
1 janv. 2014
5.686
-0.076
-1.32%
Classement des pays selon les statistiques actuelles par années


Commentaires: