29
/fr/
fr
AIzaSyAYiBZKx7MnpbEhh9jyipgxe19OcubqV5w
April 1, 2024
57318
South Asia
SAS
false
2
1
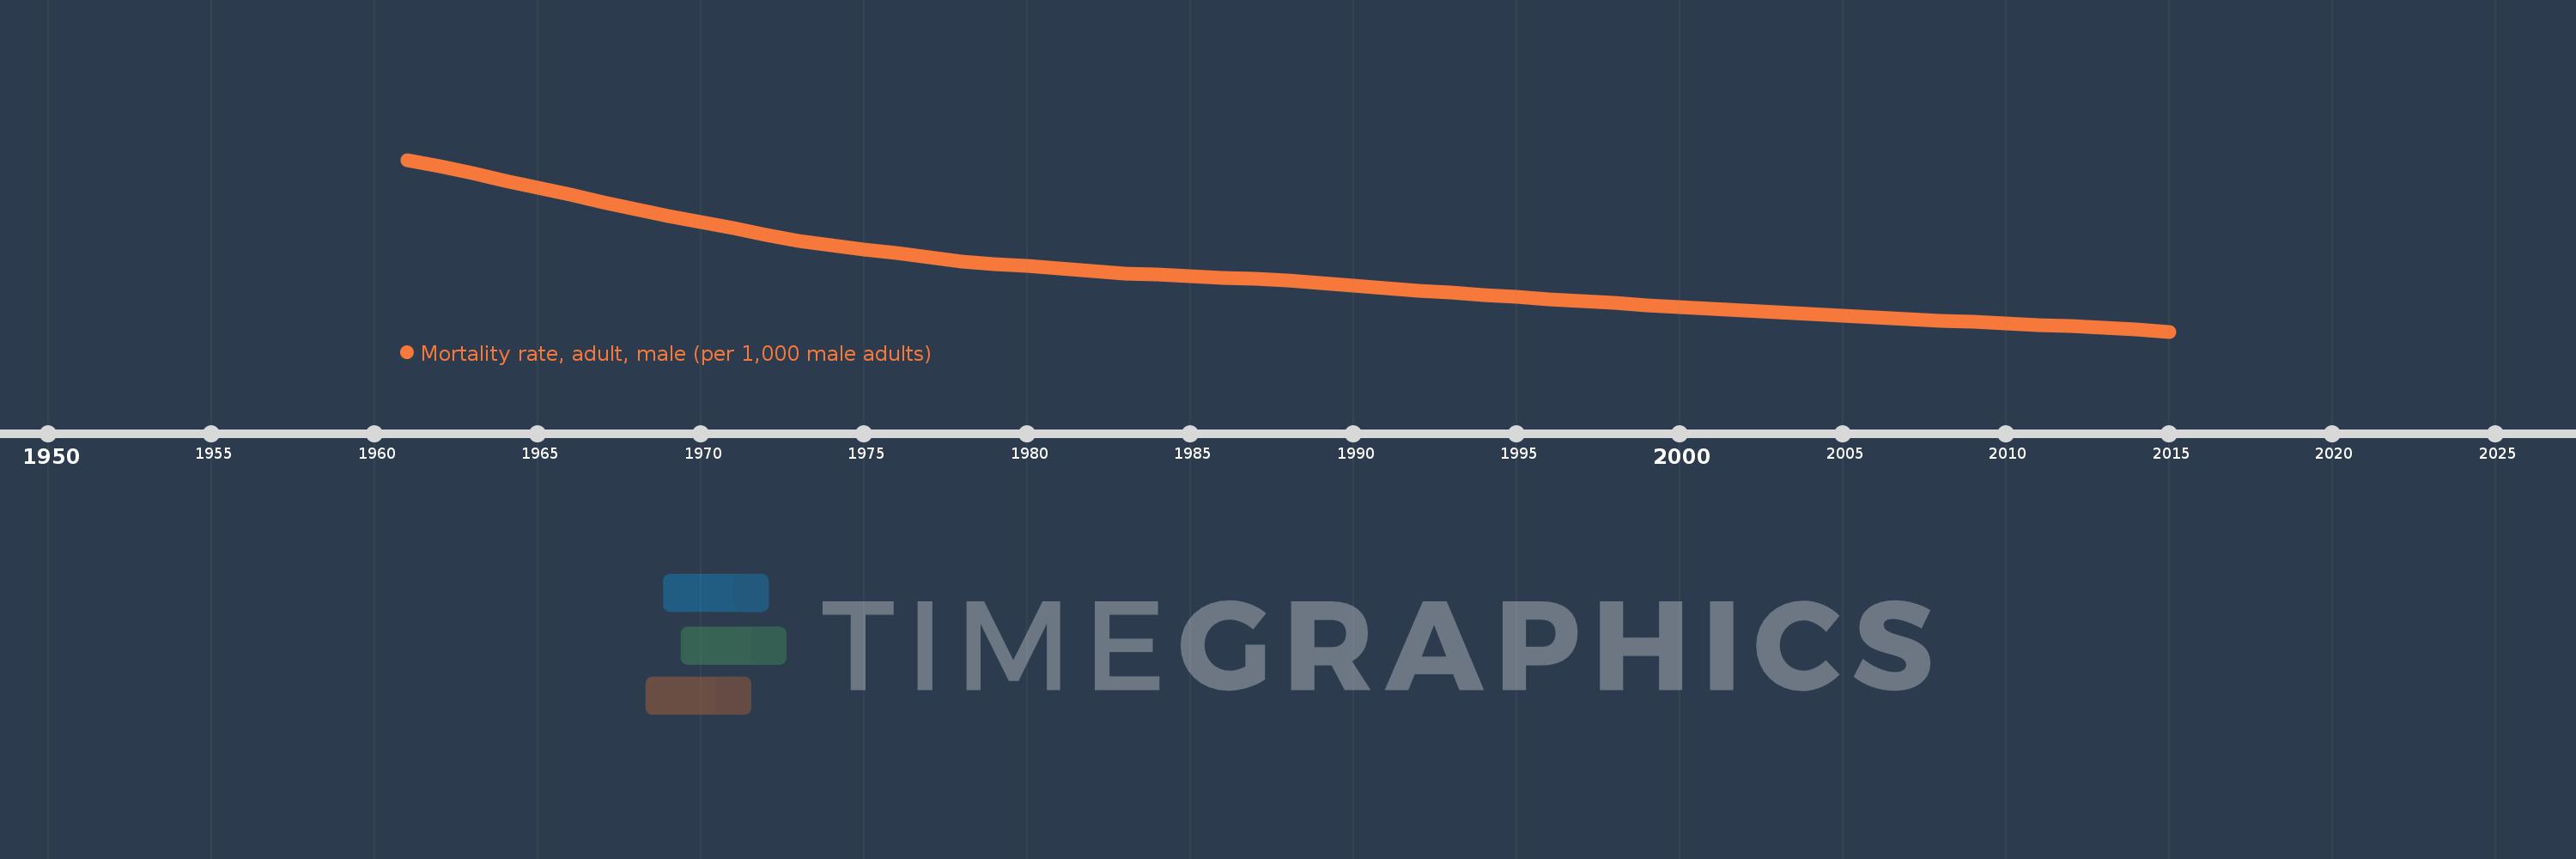
Mortality rate, adult, male (per 1,000 male adults)
2015,2014,2013,2012,2011,2010,2009,2008,2007,2006,2005,2004,2003,2002,2001,2000,1999,1998,1997,1996,1995,1994,1993,1992,1991,1990,1989,1988,1987,1986,1985,1984,1983,1982,1981,1980,1979,1978,1977,1976,1975,1974,1973,1972,1971,1970,1969,1968,1967,1966,1965,1964,1963,1962,1961
Cette statistique dans les autres pays:
AfghanistanAlbaniaAlgeriaAngolaAntigua and BarbudaArab WorldArgentinaArmeniaArubaAustraliaAustriaAzerbaijanBahamas, TheBahrainBangladeshBarbadosBelarusBelgiumBelizeBeninBhutanBoliviaBosnia and HerzegovinaBotswanaBrazilBrunei DarussalamBulgariaBurkina FasoBurundiCabo VerdeCambodiaCameroonCanadaCaribbean small statesCentral African RepublicCentral Europe and the BalticsChadChannel IslandsChileChinaColombiaComorosCongo, Dem. Rep.Congo, Rep.Costa RicaCote d'IvoireCroatiaCubaCuracaoCyprusCzech RepublicDenmarkDjiboutiDominicaDominican RepublicEarly-demographic dividendEast Asia & PacificEast Asia & Pacific (excluding high income)East Asia & Pacific (IDA & IBRD countries)EcuadorEgypt, Arab Rep.El SalvadorEquatorial GuineaEritreaEstoniaEthiopiaEuro areaEurope & Central AsiaEurope & Central Asia (excluding high income)Europe & Central Asia (IDA & IBRD countries)European UnionFijiFinlandFragile and conflict affected situationsFranceFrench PolynesiaGabonGambia, TheGeorgiaGermanyGhanaGreeceGreenlandGrenadaGuamGuatemalaGuineaGuinea-BissauGuyanaHaitiHeavily indebted poor countries (HIPC)High incomeHondurasHong Kong SAR, ChinaHungaryIBRD onlyIcelandIDA & IBRD totalIDA blendIDA onlyIDA totalIndiaIndonesiaIran, Islamic Rep.IraqIrelandIsraelItalyJamaicaJapanJordanKazakhstanKenyaKiribatiKorea, Dem. People’s Rep.Korea, Rep.KuwaitKyrgyz RepublicLao PDRLate-demographic dividendLatin America & Caribbean Latin America & Caribbean (excluding high income)Latin America & the Caribbean (IDA & IBRD countries)LatviaLeast developed countries: UN classificationLebanonLesothoLiberiaLibyaLithuaniaLow & middle incomeLow incomeLower middle incomeLuxembourgMacao SAR, ChinaMacedonia, FYRMadagascarMalawiMalaysiaMaldivesMaliMaltaMarshall IslandsMauritaniaMauritiusMexicoMicronesia, Fed. Sts.Middle East & North AfricaMiddle East & North Africa (excluding high income)Middle East & North Africa (IDA & IBRD countries)Middle incomeMoldovaMongoliaMontenegroMoroccoMozambiqueMyanmarNamibiaNepalNetherlandsNew CaledoniaNew ZealandNicaraguaNigerNigeriaNorth AmericaNorwayOECD membersOmanOther small statesPacific island small statesPakistanPanamaPapua New GuineaParaguayPeruPhilippinesPolandPortugalPost-demographic dividendPre-demographic dividendPuerto RicoQatarRomaniaRussian FederationRwandaSamoaSao Tome and PrincipeSaudi ArabiaSenegalSerbiaSeychellesSierra LeoneSingaporeSlovak RepublicSloveniaSmall statesSolomon IslandsSomaliaSouth AfricaSouth AsiaSouth Asia (IDA & IBRD)South SudanSpainSri LankaSt. Kitts and NevisSt. LuciaSt. Vincent and the GrenadinesSub-Saharan Africa Sub-Saharan Africa (excluding high income)Sub-Saharan Africa (IDA & IBRD countries)SudanSurinameSwazilandSwedenSwitzerlandSyrian Arab RepublicTajikistanTanzaniaThailandTimor-LesteTogoTongaTrinidad and TobagoTunisiaTurkeyTurkmenistanUgandaUkraineUnited Arab EmiratesUnited KingdomUnited StatesUpper middle incomeUruguayUzbekistanVanuatuVenezuela, RBVietnamVirgin Islands (U.S.)West Bank and GazaWorldYemen, Rep.ZambiaZimbabwe La ligne de temps
Cette échelle de temps montre un graphique de 1961 année à 2015 année South Asia. Les données jusqu'à 1960 année ne sont pas présentés. Quantité d'observations actuelles selon dates: 55.
Source (désignation):
Les indicateurs du développement mondiale
Source (organisation):
(1) United Nations Population Division. World Population Prospects. New York, United Nations, Department of Economic and Social Affairs (advanced Excel tables). Available at http://esa.un.org/wpp/unpp/panel_population.htm, (2) University of California, Berkeley, and Max Planck Institute for Demographic Research. Human Mortality Database. [ www.mortality.org or www.humanmortality.de].
Catégories:
Health, Gender
Dernière mise à jour
23 avr. 2017
Les indicateurs de changement de valeurs selon les années
Minimum:
207.121
1 janv. 2015
Maximum:
454.314
1 janv. 1961
Pour la date d''observation
Valeur
Changement absolu
Le changement par rapport à la valeur précédente
1 janv. 1961
454.314
+454.314
0.0%
1 janv. 1962
444.612
-9.703
-2.14%
1 janv. 1963
434.839
-9.772
-2.2%
1 janv. 1964
424.39
-10.449
-2.4%
1 janv. 1965
413.964
-10.426
-2.46%
1 janv. 1966
403.64
-10.324
-2.49%
1 janv. 1967
393.32
-10.32
-2.56%
1 janv. 1968
383.07
-10.25
-2.61%
1 janv. 1969
373.93
-9.14
-2.39%
1 janv. 1970
364.807
-9.123
-2.44%
1 janv. 1971
355.678
-9.13
-2.5%
1 janv. 1972
346.578
-9.1
-2.56%
1 janv. 1973
337.475
-9.102
-2.63%
1 janv. 1974
331.609
-5.867
-1.74%
1 janv. 1975
325.731
-5.878
-1.77%
1 janv. 1976
319.828
-5.903
-1.81%
1 janv. 1977
313.854
-5.974
-1.87%
1 janv. 1978
307.851
-6.003
-1.91%
1 janv. 1979
304.555
-3.296
-1.07%
1 janv. 1980
301.227
-3.328
-1.09%
1 janv. 1981
297.874
-3.352
-1.11%
1 janv. 1982
294.498
-3.376
-1.13%
1 janv. 1983
291.085
-3.413
-1.16%
1 janv. 1984
289.001
-2.085
-0.72%
1 janv. 1985
286.934
-2.067
-0.72%
1 janv. 1986
284.892
-2.041
-0.71%
1 janv. 1987
282.874
-2.018
-0.71%
1 janv. 1988
280.887
-1.987
-0.7%
1 janv. 1989
277.226
-3.661
-1.3%
1 janv. 1990
273.593
-3.633
-1.31%
1 janv. 1991
269.983
-3.61
-1.32%
1 janv. 1992
266.432
-3.55
-1.32%
1 janv. 1993
262.895
-3.538
-1.33%
1 janv. 1994
259.956
-2.939
-1.12%
1 janv. 1995
257.007
-2.949
-1.13%
1 janv. 1996
254.039
-2.968
-1.15%
1 janv. 1997
251.029
-3.01
-1.18%
1 janv. 1998
248.007
-3.022
-1.2%
1 janv. 1999
245.308
-2.699
-1.09%
1 janv. 2000
242.618
-2.69
-1.1%
1 janv. 2001
239.942
-2.676
-1.1%
1 janv. 2002
237.294
-2.648
-1.1%
1 janv. 2003
234.658
-2.636
-1.11%
1 janv. 2004
232.274
-2.384
-1.02%
1 janv. 2005
229.897
-2.377
-1.02%
1 janv. 2006
227.526
-2.37
-1.03%
1 janv. 2007
225.154
-2.372
-1.04%
1 janv. 2008
222.79
-2.365
-1.05%
1 janv. 2009
220.808
-1.982
-0.89%
1 janv. 2010
218.825
-1.983
-0.9%
1 janv. 2011
216.837
-1.988
-0.91%
1 janv. 2012
214.841
-1.996
-0.92%
1 janv. 2013
212.841
-2.001
-0.93%
1 janv. 2014
209.982
-2.859
-1.34%
1 janv. 2015
207.121
-2.861
-1.36%
Classement des pays selon les statistiques actuelles par années


Commentaires: