29
/fr/
fr
AIzaSyAYiBZKx7MnpbEhh9jyipgxe19OcubqV5w
April 1, 2024
167809
Kenya
KEN
true
2
1
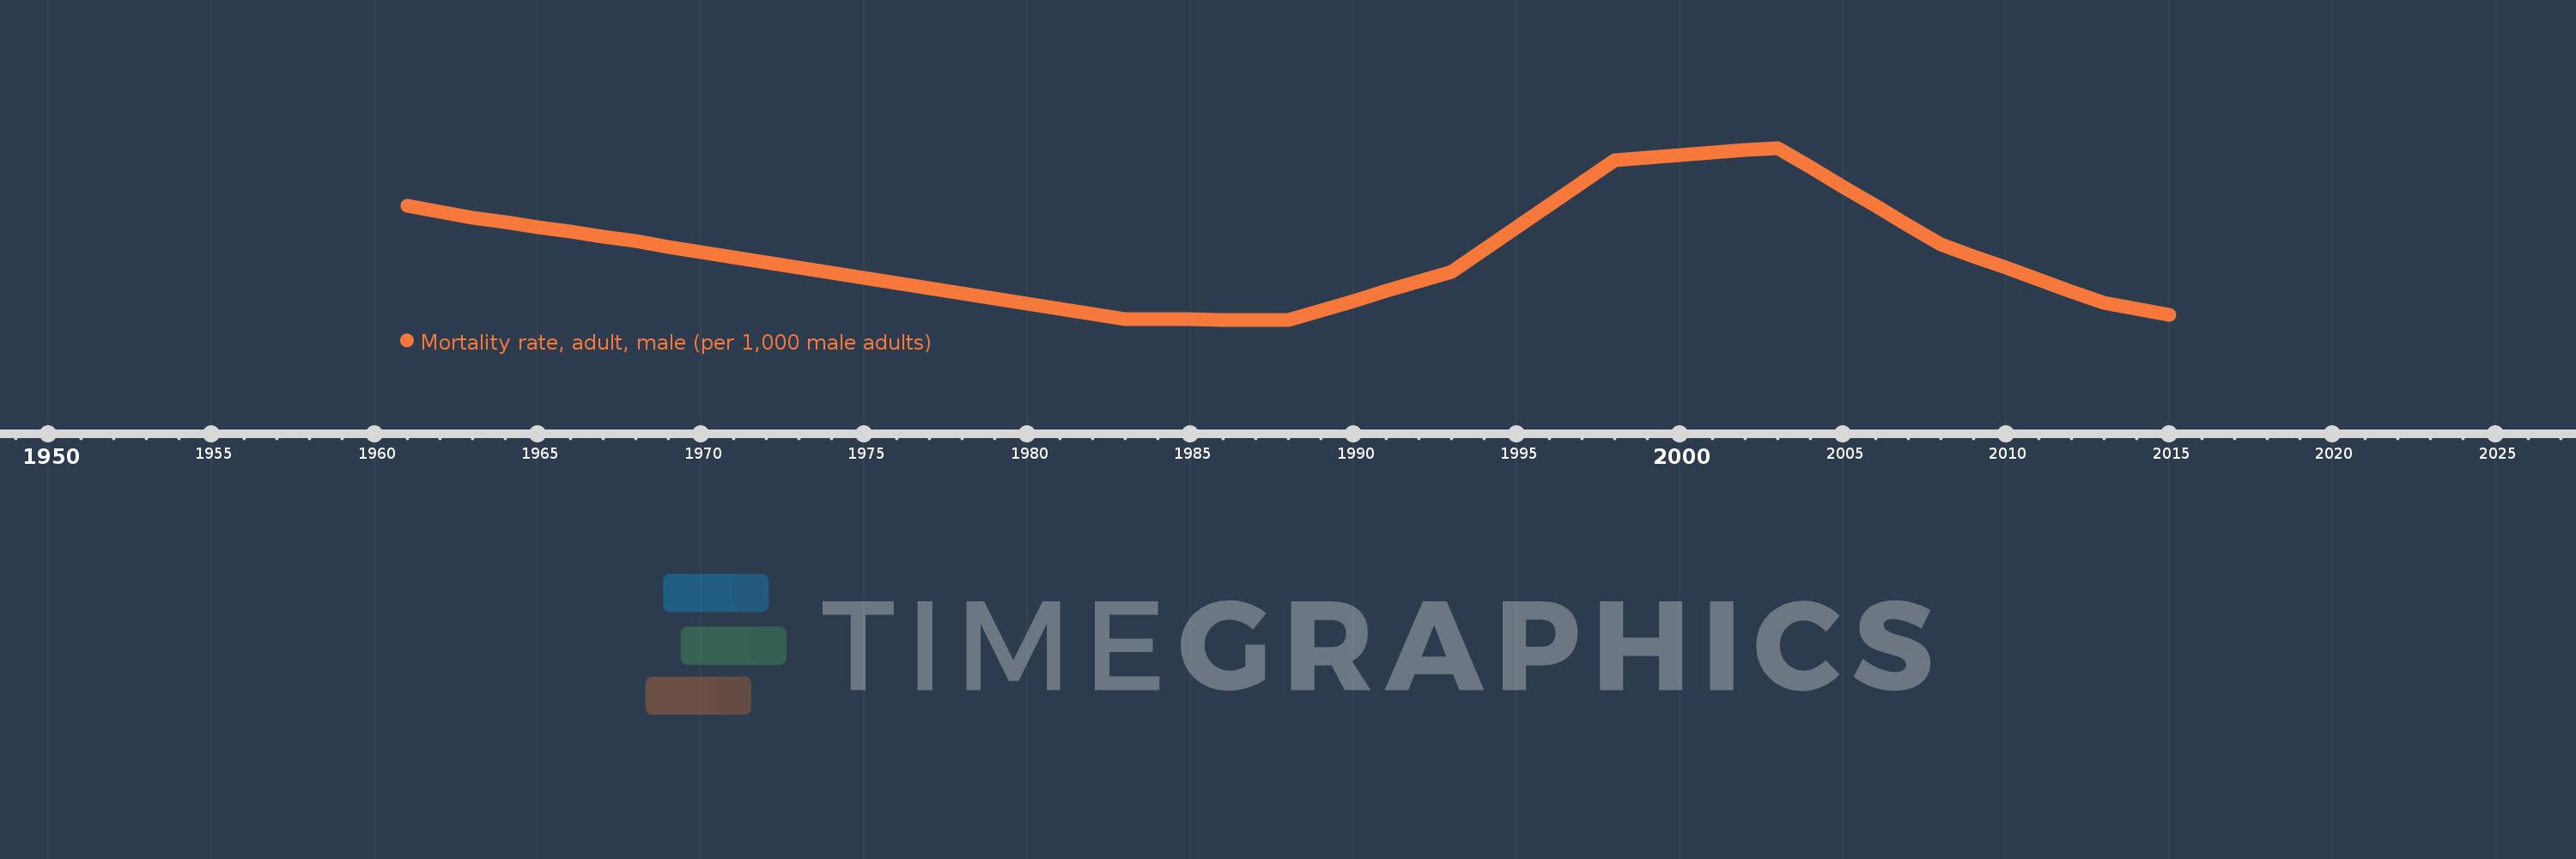
Mortality rate, adult, male (per 1,000 male adults)
2015,2014,2013,2012,2011,2010,2009,2008,2007,2006,2005,2004,2003,2002,2001,2000,1999,1998,1997,1996,1995,1994,1993,1992,1991,1990,1989,1988,1987,1986,1985,1984,1983,1982,1981,1980,1979,1978,1977,1976,1975,1974,1973,1972,1971,1970,1969,1968,1967,1966,1965,1964,1963,1962,1961
Cette statistique dans les autres pays:
AfghanistanAlbaniaAlgeriaAngolaAntigua and BarbudaArab WorldArgentinaArmeniaArubaAustraliaAustriaAzerbaijanBahamas, TheBahrainBangladeshBarbadosBelarusBelgiumBelizeBeninBhutanBoliviaBosnia and HerzegovinaBotswanaBrazilBrunei DarussalamBulgariaBurkina FasoBurundiCabo VerdeCambodiaCameroonCanadaCaribbean small statesCentral African RepublicCentral Europe and the BalticsChadChannel IslandsChileChinaColombiaComorosCongo, Dem. Rep.Congo, Rep.Costa RicaCote d'IvoireCroatiaCubaCuracaoCyprusCzech RepublicDenmarkDjiboutiDominicaDominican RepublicEarly-demographic dividendEast Asia & PacificEast Asia & Pacific (excluding high income)East Asia & Pacific (IDA & IBRD countries)EcuadorEgypt, Arab Rep.El SalvadorEquatorial GuineaEritreaEstoniaEthiopiaEuro areaEurope & Central AsiaEurope & Central Asia (excluding high income)Europe & Central Asia (IDA & IBRD countries)European UnionFijiFinlandFragile and conflict affected situationsFranceFrench PolynesiaGabonGambia, TheGeorgiaGermanyGhanaGreeceGreenlandGrenadaGuamGuatemalaGuineaGuinea-BissauGuyanaHaitiHeavily indebted poor countries (HIPC)High incomeHondurasHong Kong SAR, ChinaHungaryIBRD onlyIcelandIDA & IBRD totalIDA blendIDA onlyIDA totalIndiaIndonesiaIran, Islamic Rep.IraqIrelandIsraelItalyJamaicaJapanJordanKazakhstanKenyaKiribatiKorea, Dem. People’s Rep.Korea, Rep.KuwaitKyrgyz RepublicLao PDRLate-demographic dividendLatin America & Caribbean Latin America & Caribbean (excluding high income)Latin America & the Caribbean (IDA & IBRD countries)LatviaLeast developed countries: UN classificationLebanonLesothoLiberiaLibyaLithuaniaLow & middle incomeLow incomeLower middle incomeLuxembourgMacao SAR, ChinaMacedonia, FYRMadagascarMalawiMalaysiaMaldivesMaliMaltaMarshall IslandsMauritaniaMauritiusMexicoMicronesia, Fed. Sts.Middle East & North AfricaMiddle East & North Africa (excluding high income)Middle East & North Africa (IDA & IBRD countries)Middle incomeMoldovaMongoliaMontenegroMoroccoMozambiqueMyanmarNamibiaNepalNetherlandsNew CaledoniaNew ZealandNicaraguaNigerNigeriaNorth AmericaNorwayOECD membersOmanOther small statesPacific island small statesPakistanPanamaPapua New GuineaParaguayPeruPhilippinesPolandPortugalPost-demographic dividendPre-demographic dividendPuerto RicoQatarRomaniaRussian FederationRwandaSamoaSao Tome and PrincipeSaudi ArabiaSenegalSerbiaSeychellesSierra LeoneSingaporeSlovak RepublicSloveniaSmall statesSolomon IslandsSomaliaSouth AfricaSouth AsiaSouth Asia (IDA & IBRD)South SudanSpainSri LankaSt. Kitts and NevisSt. LuciaSt. Vincent and the GrenadinesSub-Saharan Africa Sub-Saharan Africa (excluding high income)Sub-Saharan Africa (IDA & IBRD countries)SudanSurinameSwazilandSwedenSwitzerlandSyrian Arab RepublicTajikistanTanzaniaThailandTimor-LesteTogoTongaTrinidad and TobagoTunisiaTurkeyTurkmenistanUgandaUkraineUnited Arab EmiratesUnited KingdomUnited StatesUpper middle incomeUruguayUzbekistanVanuatuVenezuela, RBVietnamVirgin Islands (U.S.)West Bank and GazaWorldYemen, Rep.ZambiaZimbabwe La ligne de temps
Cette échelle de temps montre un graphique de 1961 année à 2015 année Kenya. Les données jusqu'à 1960 année ne sont pas présentés. Quantité d'observations actuelles selon dates: 55.
Source (désignation):
Les indicateurs du développement mondiale
Source (organisation):
(1) United Nations Population Division. World Population Prospects. New York, United Nations, Department of Economic and Social Affairs (advanced Excel tables). Available at http://esa.un.org/wpp/unpp/panel_population.htm, (2) University of California, Berkeley, and Max Planck Institute for Demographic Research. Human Mortality Database. [ www.mortality.org or www.humanmortality.de].
Catégories:
Health, Gender
Dernière mise à jour
23 avr. 2017
Les indicateurs de changement de valeurs selon les années
Minimum:
290.58
1 janv. 1988
Maximum:
477.322
1 janv. 2003
Pour la date d''observation
Valeur
Changement absolu
Le changement par rapport à la valeur précédente
1 janv. 1961
414.522
+414.522
0.0%
1 janv. 1962
408.189
-6.333
-1.53%
1 janv. 1963
401.856
-6.333
-1.55%
1 janv. 1964
396.646
-5.21
-1.3%
1 janv. 1965
391.437
-5.209
-1.31%
1 janv. 1966
386.228
-5.209
-1.33%
1 janv. 1967
381.018
-5.21
-1.35%
1 janv. 1968
375.809
-5.209
-1.37%
1 janv. 1969
370.011
-5.798
-1.54%
1 janv. 1970
364.212
-5.799
-1.57%
1 janv. 1971
358.414
-5.798
-1.59%
1 janv. 1972
352.616
-5.798
-1.62%
1 janv. 1973
346.817
-5.799
-1.64%
1 janv. 1974
341.386
-5.431
-1.57%
1 janv. 1975
335.954
-5.432
-1.59%
1 janv. 1976
330.522
-5.432
-1.62%
1 janv. 1977
325.09
-5.432
-1.64%
1 janv. 1978
319.658
-5.432
-1.67%
1 janv. 1979
313.934
-5.724
-1.79%
1 janv. 1980
308.21
-5.724
-1.82%
1 janv. 1981
302.486
-5.724
-1.86%
1 janv. 1982
296.762
-5.724
-1.89%
1 janv. 1983
291.038
-5.724
-1.93%
1 janv. 1984
290.947
-0.091
-0.03%
1 janv. 1985
290.855
-0.092
-0.03%
1 janv. 1986
290.763
-0.092
-0.03%
1 janv. 1987
290.672
-0.091
-0.03%
1 janv. 1988
290.58
-0.092
-0.03%
1 janv. 1989
300.918
+10.338
3.56%
1 janv. 1990
311.255
+10.337
3.44%
1 janv. 1991
321.592
+10.337
3.32%
1 janv. 1992
331.93
+10.338
3.21%
1 janv. 1993
342.267
+10.337
3.11%
1 janv. 1994
366.689
+24.422
7.14%
1 janv. 1995
391.11
+24.421
6.66%
1 janv. 1996
415.532
+24.422
6.24%
1 janv. 1997
439.954
+24.422
5.88%
1 janv. 1998
464.375
+24.421
5.55%
1 janv. 1999
466.965
+2.59
0.56%
1 janv. 2000
469.554
+2.589
0.55%
1 janv. 2001
472.144
+2.59
0.55%
1 janv. 2002
474.733
+2.589
0.55%
1 janv. 2003
477.322
+2.589
0.55%
1 janv. 2004
456.345
-20.977
-4.39%
1 janv. 2005
435.368
-20.977
-4.6%
1 janv. 2006
414.391
-20.977
-4.82%
1 janv. 2007
393.414
-20.977
-5.06%
1 janv. 2008
372.437
-20.977
-5.33%
1 janv. 2009
359.676
-12.761
-3.43%
1 janv. 2010
346.915
-12.761
-3.55%
1 janv. 2011
334.154
-12.761
-3.68%
1 janv. 2012
321.393
-12.761
-3.82%
1 janv. 2013
308.632
-12.761
-3.97%
1 janv. 2014
302.271
-6.361
-2.06%
1 janv. 2015
295.91
-6.361
-2.1%
Classement des pays selon les statistiques actuelles par années


Commentaires: