29
/fr/
fr
AIzaSyAYiBZKx7MnpbEhh9jyipgxe19OcubqV5w
April 1, 2024
52875
OECD members
OED
false
2
1
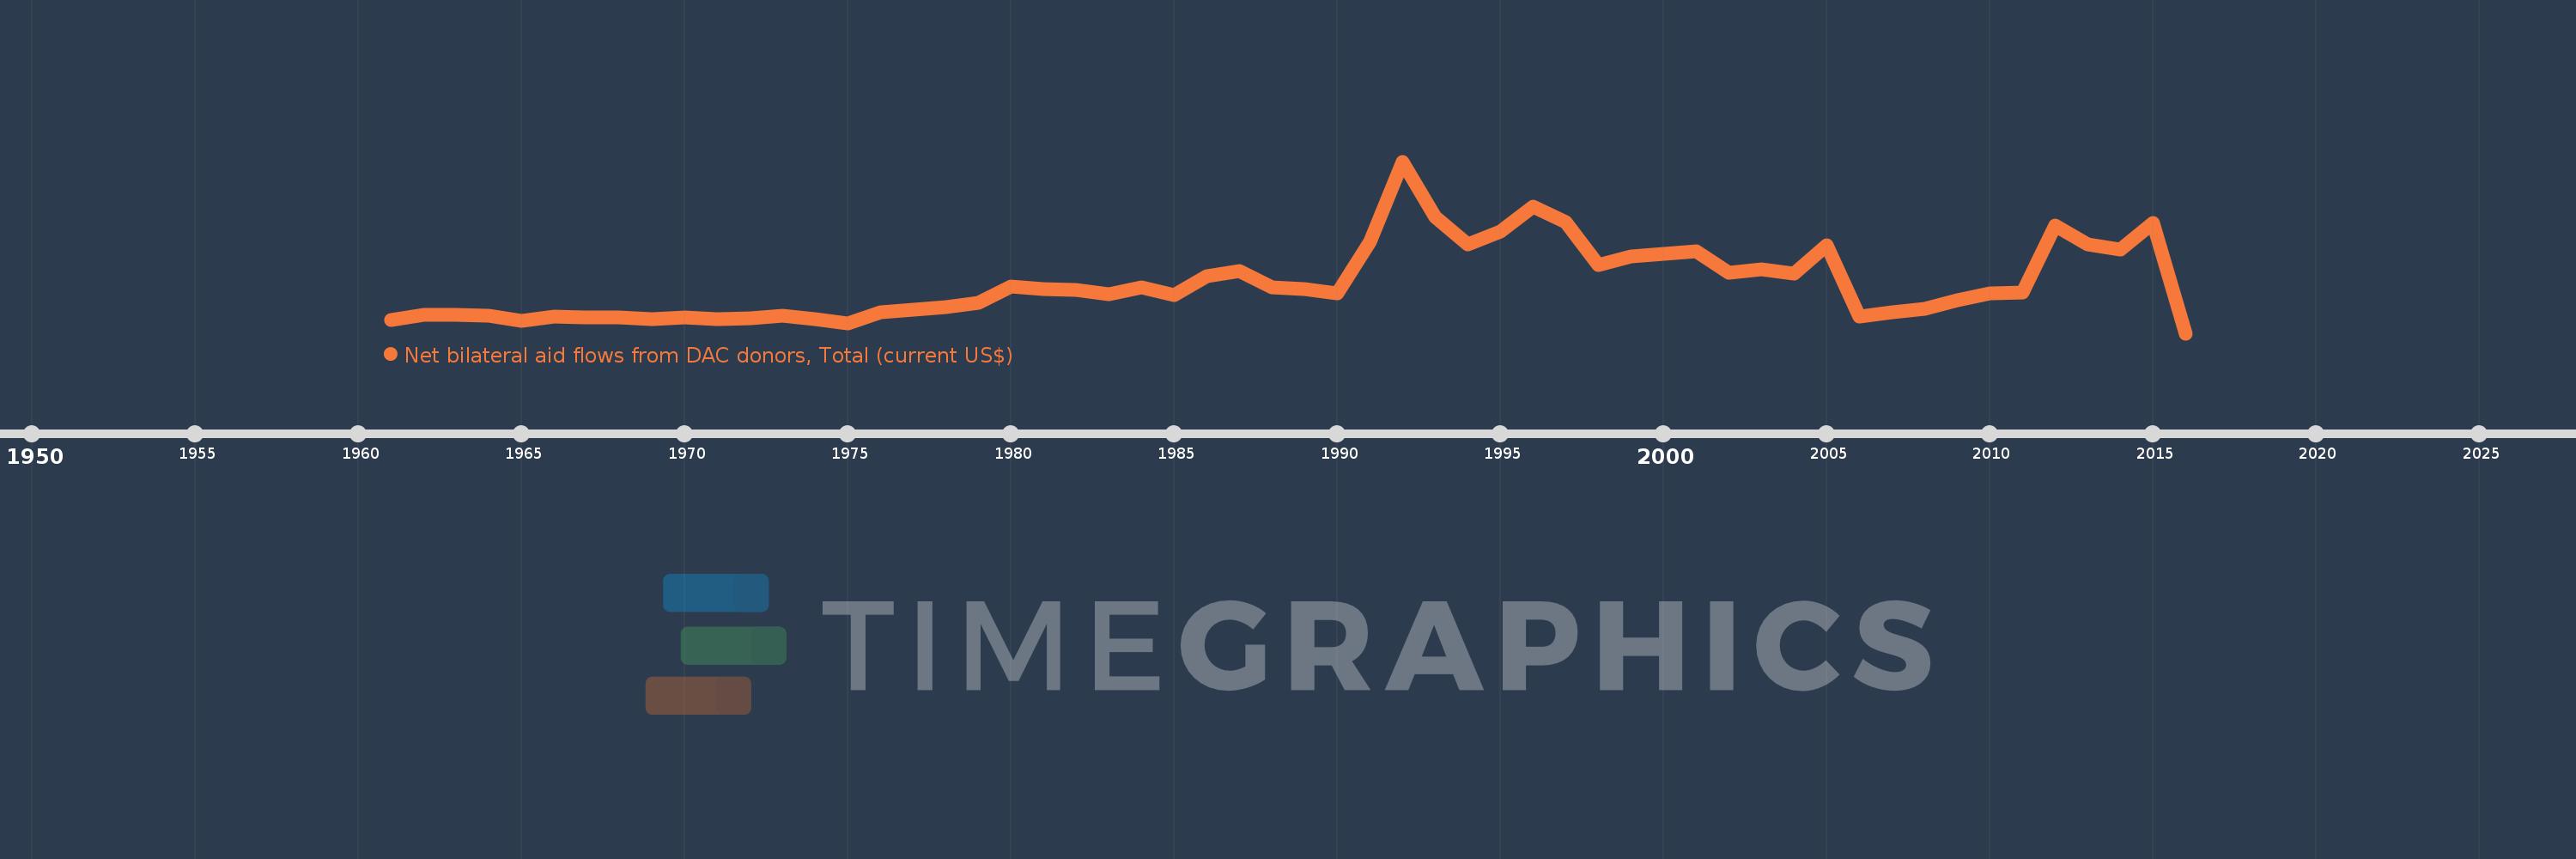
Net bilateral aid flows from DAC donors, Total (current US$)
2016,2015,2014,2013,2012,2011,2010,2009,2008,2007,2006,2005,2004,2003,2002,2001,2000,1999,1998,1997,1996,1995,1994,1993,1992,1991,1990,1989,1988,1987,1986,1985,1984,1983,1982,1981,1980,1979,1978,1977,1976,1975,1974,1973,1972,1971,1970,1969,1968,1967,1966,1965,1964,1963,1962,1961
Cette statistique dans les autres pays:
AfghanistanAlbaniaAlgeriaAngolaAntigua and BarbudaArab WorldArgentinaArmeniaArubaAzerbaijanBahamas, TheBahrainBangladeshBarbadosBelarusBelizeBeninBermudaBhutanBoliviaBosnia and HerzegovinaBotswanaBrazilBritish Virgin IslandsBrunei DarussalamBulgariaBurkina FasoBurundiCabo VerdeCambodiaCameroonCaribbean small statesCayman IslandsCentral African RepublicCentral Europe and the BalticsChadChileChinaColombiaComorosCongo, Dem. Rep.Congo, Rep.Costa RicaCote d'IvoireCroatiaCubaCyprusCzech RepublicDjiboutiDominicaDominican RepublicEast Asia & PacificEast Asia & Pacific (excluding high income)East Asia & Pacific (IDA & IBRD countries)EcuadorEgypt, Arab Rep.El SalvadorEquatorial GuineaEritreaEstoniaEthiopiaEuro areaEurope & Central AsiaEurope & Central Asia (excluding high income)Europe & Central Asia (IDA & IBRD countries)European UnionFijiFragile and conflict affected situationsFrench PolynesiaGabonGambia, TheGeorgiaGhanaGibraltarGrenadaGuatemalaGuineaGuinea-BissauGuyanaHaitiHeavily indebted poor countries (HIPC)High incomeHondurasHong Kong SAR, ChinaHungaryIBRD onlyIDA & IBRD totalIDA blendIDA onlyIDA totalIndiaIndonesiaIran, Islamic Rep.IraqIsraelJamaicaJordanKazakhstanKenyaKiribatiKorea, Dem. People’s Rep.Korea, Rep.KosovoKuwaitKyrgyz RepublicLao PDRLatin America & Caribbean Latin America & Caribbean (excluding high income)Latin America & the Caribbean (IDA & IBRD countries)LatviaLeast developed countries: UN classificationLebanonLesothoLiberiaLibyaLithuaniaLow & middle incomeLow incomeLower middle incomeMacao SAR, ChinaMacedonia, FYRMadagascarMalawiMalaysiaMaldivesMaliMaltaMarshall IslandsMauritaniaMauritiusMexicoMicronesia, Fed. Sts.Middle East & North AfricaMiddle East & North Africa (excluding high income)Middle East & North Africa (IDA & IBRD countries)Middle incomeMoldovaMongoliaMontenegroMoroccoMozambiqueMyanmarNamibiaNauruNepalNew CaledoniaNicaraguaNigerNigeriaNorth AmericaNorthern Mariana IslandsOECD membersOmanOther small statesPacific island small statesPakistanPalauPanamaPapua New GuineaParaguayPeruPhilippinesPolandQatarRomaniaRussian FederationRwandaSamoaSao Tome and PrincipeSaudi ArabiaSenegalSerbiaSeychellesSierra LeoneSingaporeSlovak RepublicSloveniaSmall statesSolomon IslandsSomaliaSouth AfricaSouth AsiaSouth Asia (IDA & IBRD)South SudanSri LankaSt. Kitts and NevisSt. LuciaSt. Vincent and the GrenadinesSub-Saharan Africa Sub-Saharan Africa (excluding high income)Sub-Saharan Africa (IDA & IBRD countries)SudanSurinameSwazilandSyrian Arab RepublicTajikistanTanzaniaThailandTimor-LesteTogoTongaTrinidad and TobagoTunisiaTurkeyTurkmenistanTurks and Caicos IslandsTuvaluUgandaUkraineUnited Arab EmiratesUpper middle incomeUruguayUzbekistanVanuatuVenezuela, RBVietnamWest Bank and GazaWorldYemen, Rep.ZambiaZimbabwe La ligne de temps
Cette échelle de temps montre un graphique de 1961 année à 2016 année OECD members. Les données jusqu'à 1960 année ne sont pas présentés. Quantité d'observations actuelles selon dates: 56.
Source (désignation):
Les indicateurs du développement mondiale
Source (organisation):
Development Assistance Committee of the Organisation for Economic Co-operation and Development, Geographical Distribution of Financial Flows to Developing Countries, Development Co-operation Report, and International Development Statistics database. Data are available online at: www.oecd.org/dac/stats/idsonline.
Catégories:
Aid Effectiveness
Dernière mise à jour
23 avr. 2017
Les indicateurs de changement de valeurs selon les années
Maximum:
6.816 mds
1 janv. 1992
Pour la date d''observation
Valeur
Changement absolu
Le changement par rapport à la valeur précédente
1 janv. 1961
515.56 mln.
+515.56 mln.
0.0%
1 janv. 1962
737.19 mln.
+221.63 mln.
42.99%
1 janv. 1963
738.88 mln.
+1.69 mln.
0.23%
1 janv. 1964
714.78 mln.
-24.1 mln.
-3.26%
1 janv. 1965
500.92 mln.
-213.86 mln.
-29.92%
1 janv. 1966
663.06 mln.
+162.14 mln.
32.37%
1 janv. 1967
645.53 mln.
-17.53 mln.
-2.64%
1 janv. 1968
618.47 mln.
-27.06 mln.
-4.19%
1 janv. 1969
568.39 mln.
-50.08 mln.
-8.1%
1 janv. 1970
619.24 mln.
+50.85 mln.
8.95%
1 janv. 1971
561.98 mln.
-57.26 mln.
-9.25%
1 janv. 1972
583.83 mln.
+21.85 mln.
3.89%
1 janv. 1973
701.1 mln.
+117.27 mln.
20.09%
1 janv. 1974
556.98 mln.
-144.12 mln.
-20.56%
1 janv. 1975
391.59 mln.
-165.39 mln.
-29.69%
1 janv. 1976
820.05 mln.
+428.46 mln.
109.42%
1 janv. 1977
936.45 mln.
+116.4 mln.
14.19%
1 janv. 1978
1.043 mds
+106.29 mln.
11.35%
1 janv. 1979
1.204 mds
+161.38 mln.
15.48%
1 janv. 1980
1.863 mds
+659.07 mln.
54.73%
1 janv. 1981
1.763 mds
-100.33 mln.
-5.38%
1 janv. 1982
1.73 mds
-32.44 mln.
-1.84%
1 janv. 1983
1.55 mds
-180.31 mln.
-10.42%
1 janv. 1984
1.819 mds
+268.78 mln.
17.34%
1 janv. 1985
1.512 mds
-306.83 mln.
-16.87%
1 janv. 1986
2.281 mds
+769.21 mln.
50.87%
1 janv. 1987
2.469 mds
+187.62 mln.
8.22%
1 janv. 1988
1.824 mds
-644.83 mln.
-26.12%
1 janv. 1989
1.748 mds
-76.49 mln.
-4.19%
1 janv. 1990
1.572 mds
-175.44 mln.
-10.04%
1 janv. 1991
3.623 mds
+2.051 mds
130.46%
1 janv. 1992
6.816 mds
+3.193 mds
88.13%
1 janv. 1993
4.629 mds
-2.188 mds
-32.09%
1 janv. 1994
3.519 mds
-1.11 mds
-23.97%
1 janv. 1995
4.034 mds
+514.97 mln.
14.63%
1 janv. 1996
5.04 mds
+1.006 mds
24.94%
1 janv. 1997
4.398 mds
-642.2 mln.
-12.74%
1 janv. 1998
2.712 mds
-1.685 mds
-38.32%
1 janv. 1999
3.052 mds
+339.84 mln.
12.53%
1 janv. 2000
3.159 mds
+107.12 mln.
3.51%
1 janv. 2001
3.266 mds
+106.16 mln.
3.36%
1 janv. 2002
2.418 mds
-847.8 mln.
-25.96%
1 janv. 2003
2.529 mds
+110.68 mln.
4.58%
1 janv. 2004
2.38 mds
-148.73 mln.
-5.88%
1 janv. 2005
3.501 mds
+1.122 mds
47.13%
1 janv. 2006
666.07 mln.
-2.835 mds
-80.98%
1 janv. 2007
848.78 mln.
+182.71 mln.
27.43%
1 janv. 2008
971.1 mln.
+122.32 mln.
14.41%
1 janv. 2009
1.318 mds
+346.77 mln.
35.71%
1 janv. 2010
1.582 mds
+264.05 mln.
20.04%
1 janv. 2011
1.632 mds
+50.35 mln.
3.18%
1 janv. 2012
4.273 mds
+2.641 mds
161.8%
1 janv. 2013
3.519 mds
-754.54 mln.
-17.66%
1 janv. 2014
3.324 mds
-194.83 mln.
-5.54%
1 janv. 2015
4.375 mds
+1.051 mds
31.61%
1 janv. 2016
0.0
-4.375 mds
-100.0%
Classement des pays selon les statistiques actuelles par années


Commentaires: