29
/fr/
fr
AIzaSyAYiBZKx7MnpbEhh9jyipgxe19OcubqV5w
April 1, 2024
32885
Europe & Central Asia (IDA & IBRD countries)
TEC
false
2
1
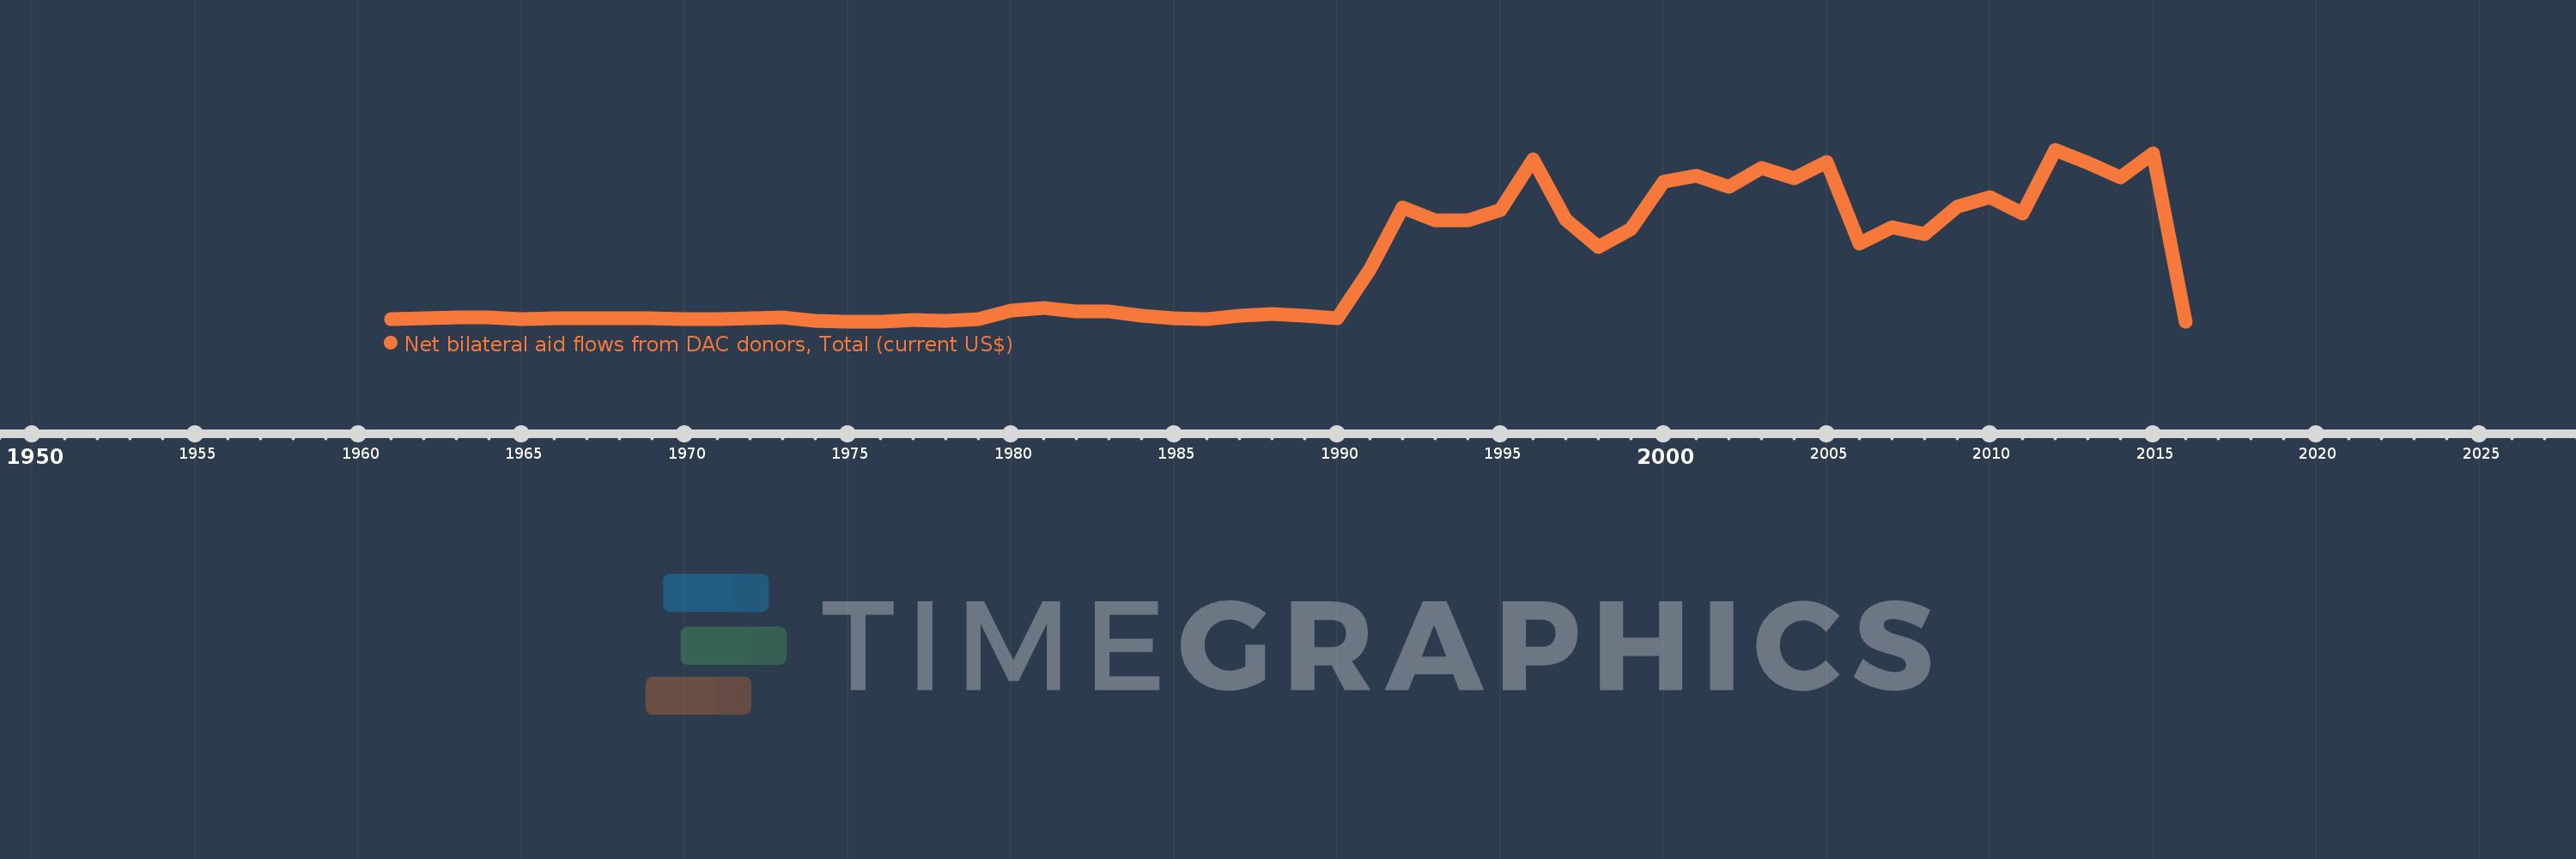
Net bilateral aid flows from DAC donors, Total (current US$)
2016,2015,2014,2013,2012,2011,2010,2009,2008,2007,2006,2005,2004,2003,2002,2001,2000,1999,1998,1997,1996,1995,1994,1993,1992,1991,1990,1989,1988,1987,1986,1985,1984,1983,1982,1981,1980,1979,1978,1977,1976,1975,1974,1973,1972,1971,1970,1969,1968,1967,1966,1965,1964,1963,1962,1961
Cette statistique dans les autres pays:
AfghanistanAlbaniaAlgeriaAngolaAntigua and BarbudaArab WorldArgentinaArmeniaArubaAzerbaijanBahamas, TheBahrainBangladeshBarbadosBelarusBelizeBeninBermudaBhutanBoliviaBosnia and HerzegovinaBotswanaBrazilBritish Virgin IslandsBrunei DarussalamBulgariaBurkina FasoBurundiCabo VerdeCambodiaCameroonCaribbean small statesCayman IslandsCentral African RepublicCentral Europe and the BalticsChadChileChinaColombiaComorosCongo, Dem. Rep.Congo, Rep.Costa RicaCote d'IvoireCroatiaCubaCyprusCzech RepublicDjiboutiDominicaDominican RepublicEast Asia & PacificEast Asia & Pacific (excluding high income)East Asia & Pacific (IDA & IBRD countries)EcuadorEgypt, Arab Rep.El SalvadorEquatorial GuineaEritreaEstoniaEthiopiaEuro areaEurope & Central AsiaEurope & Central Asia (excluding high income)Europe & Central Asia (IDA & IBRD countries)European UnionFijiFragile and conflict affected situationsFrench PolynesiaGabonGambia, TheGeorgiaGhanaGibraltarGrenadaGuatemalaGuineaGuinea-BissauGuyanaHaitiHeavily indebted poor countries (HIPC)High incomeHondurasHong Kong SAR, ChinaHungaryIBRD onlyIDA & IBRD totalIDA blendIDA onlyIDA totalIndiaIndonesiaIran, Islamic Rep.IraqIsraelJamaicaJordanKazakhstanKenyaKiribatiKorea, Dem. People’s Rep.Korea, Rep.KosovoKuwaitKyrgyz RepublicLao PDRLatin America & Caribbean Latin America & Caribbean (excluding high income)Latin America & the Caribbean (IDA & IBRD countries)LatviaLeast developed countries: UN classificationLebanonLesothoLiberiaLibyaLithuaniaLow & middle incomeLow incomeLower middle incomeMacao SAR, ChinaMacedonia, FYRMadagascarMalawiMalaysiaMaldivesMaliMaltaMarshall IslandsMauritaniaMauritiusMexicoMicronesia, Fed. Sts.Middle East & North AfricaMiddle East & North Africa (excluding high income)Middle East & North Africa (IDA & IBRD countries)Middle incomeMoldovaMongoliaMontenegroMoroccoMozambiqueMyanmarNamibiaNauruNepalNew CaledoniaNicaraguaNigerNigeriaNorth AmericaNorthern Mariana IslandsOECD membersOmanOther small statesPacific island small statesPakistanPalauPanamaPapua New GuineaParaguayPeruPhilippinesPolandQatarRomaniaRussian FederationRwandaSamoaSao Tome and PrincipeSaudi ArabiaSenegalSerbiaSeychellesSierra LeoneSingaporeSlovak RepublicSloveniaSmall statesSolomon IslandsSomaliaSouth AfricaSouth AsiaSouth Asia (IDA & IBRD)South SudanSri LankaSt. Kitts and NevisSt. LuciaSt. Vincent and the GrenadinesSub-Saharan Africa Sub-Saharan Africa (excluding high income)Sub-Saharan Africa (IDA & IBRD countries)SudanSurinameSwazilandSyrian Arab RepublicTajikistanTanzaniaThailandTimor-LesteTogoTongaTrinidad and TobagoTunisiaTurkeyTurkmenistanTurks and Caicos IslandsTuvaluUgandaUkraineUnited Arab EmiratesUpper middle incomeUruguayUzbekistanVanuatuVenezuela, RBVietnamWest Bank and GazaWorldYemen, Rep.ZambiaZimbabwe La ligne de temps
Cette échelle de temps montre un graphique de 1961 année à 2016 année Europe & Central Asia (IDA & IBRD countries). Les données jusqu'à 1960 année ne sont pas présentés. Quantité d'observations actuelles selon dates: 56.
Source (désignation):
Les indicateurs du développement mondiale
Source (organisation):
Development Assistance Committee of the Organisation for Economic Co-operation and Development, Geographical Distribution of Financial Flows to Developing Countries, Development Co-operation Report, and International Development Statistics database. Data are available online at: www.oecd.org/dac/stats/idsonline.
Catégories:
Aid Effectiveness
Dernière mise à jour
23 avr. 2017
Les indicateurs de changement de valeurs selon les années
Maximum:
8.717 mds
1 janv. 2012
Pour la date d''observation
Valeur
Changement absolu
Le changement par rapport à la valeur précédente
1 janv. 1961
137.46 mln.
+137.46 mln.
0.0%
1 janv. 1962
188.63 mln.
+51.17 mln.
37.23%
1 janv. 1963
229.03 mln.
+40.4 mln.
21.42%
1 janv. 1964
221.87 mln.
-7.16 mln.
-3.13%
1 janv. 1965
153.95 mln.
-67.92 mln.
-30.61%
1 janv. 1966
176.38 mln.
+22.43 mln.
14.57%
1 janv. 1967
184.44 mln.
+8.06 mln.
4.57%
1 janv. 1968
180.16 mln.
-4.28 mln.
-2.32%
1 janv. 1969
174.63 mln.
-5.53 mln.
-3.07%
1 janv. 1970
147.65 mln.
-26.98 mln.
-15.45%
1 janv. 1971
157.49 mln.
+9.84 mln.
6.66%
1 janv. 1972
177.04 mln.
+19.55 mln.
12.41%
1 janv. 1973
220.82 mln.
+43.78 mln.
24.73%
1 janv. 1974
71.4 mln.
-149.42 mln.
-67.67%
1 janv. 1975
27.91 mln.
-43.49 mln.
-60.91%
1 janv. 1976
24.77 mln.
-3.14 mln.
-11.25%
1 janv. 1977
98.43 mln.
+73.66 mln.
297.38%
1 janv. 1978
62.2 mln.
-36.23 mln.
-36.81%
1 janv. 1979
160.52 mln.
+98.32 mln.
158.07%
1 janv. 1980
563.4 mln.
+402.88 mln.
250.98%
1 janv. 1981
711.78 mln.
+148.38 mln.
26.34%
1 janv. 1982
534.5 mln.
-177.28 mln.
-24.91%
1 janv. 1983
539.16 mln.
+4.66 mln.
0.87%
1 janv. 1984
321.69 mln.
-217.47 mln.
-40.33%
1 janv. 1985
206.02 mln.
-115.67 mln.
-35.96%
1 janv. 1986
140.99 mln.
-65.03 mln.
-31.56%
1 janv. 1987
307.34 mln.
+166.35 mln.
117.99%
1 janv. 1988
394.1 mln.
+86.76 mln.
28.23%
1 janv. 1989
305.6 mln.
-88.5 mln.
-22.46%
1 janv. 1990
180.25 mln.
-125.35 mln.
-41.02%
1 janv. 1991
2.662 mds
+2.482 mds
1.38 milles%
1 janv. 1992
5.828 mds
+3.166 mds
118.93%
1 janv. 1993
5.155 mds
-672.76 mln.
-11.54%
1 janv. 1994
5.138 mds
-17.59 mln.
-0.34%
1 janv. 1995
5.664 mds
+526.08 mln.
10.24%
1 janv. 1996
8.27 mds
+2.606 mds
46.01%
1 janv. 1997
5.205 mds
-3.064 mds
-37.06%
1 janv. 1998
3.819 mds
-1.386 mds
-26.63%
1 janv. 1999
4.73 mds
+910.74 mln.
23.85%
1 janv. 2000
7.129 mds
+2.399 mds
50.73%
1 janv. 2001
7.421 mds
+291.98 mln.
4.1%
1 janv. 2002
6.85 mds
-570.79 mln.
-7.69%
1 janv. 2003
7.808 mds
+957.94 mln.
13.98%
1 janv. 2004
7.293 mds
-515.36 mln.
-6.6%
1 janv. 2005
8.111 mds
+818.05 mln.
11.22%
1 janv. 2006
3.963 mds
-4.148 mds
-51.14%
1 janv. 2007
4.827 mds
+864.08 mln.
21.8%
1 janv. 2008
4.439 mds
-387.78 mln.
-8.03%
1 janv. 2009
5.845 mds
+1.406 mds
31.67%
1 janv. 2010
6.321 mds
+475.87 mln.
8.14%
1 janv. 2011
5.498 mds
-823.44 mln.
-13.03%
1 janv. 2012
8.717 mds
+3.22 mds
58.56%
1 janv. 2013
8.085 mds
-632.12 mln.
-7.25%
1 janv. 2014
7.337 mds
-748.58 mln.
-9.26%
1 janv. 2015
8.555 mds
+1.218 mds
16.61%
1 janv. 2016
0.0
-8.555 mds
-100.0%
Classement des pays selon les statistiques actuelles par années


Commentaires: