29
/fr/
fr
AIzaSyAYiBZKx7MnpbEhh9jyipgxe19OcubqV5w
April 1, 2024
51813
North America
NAC
false
2
1
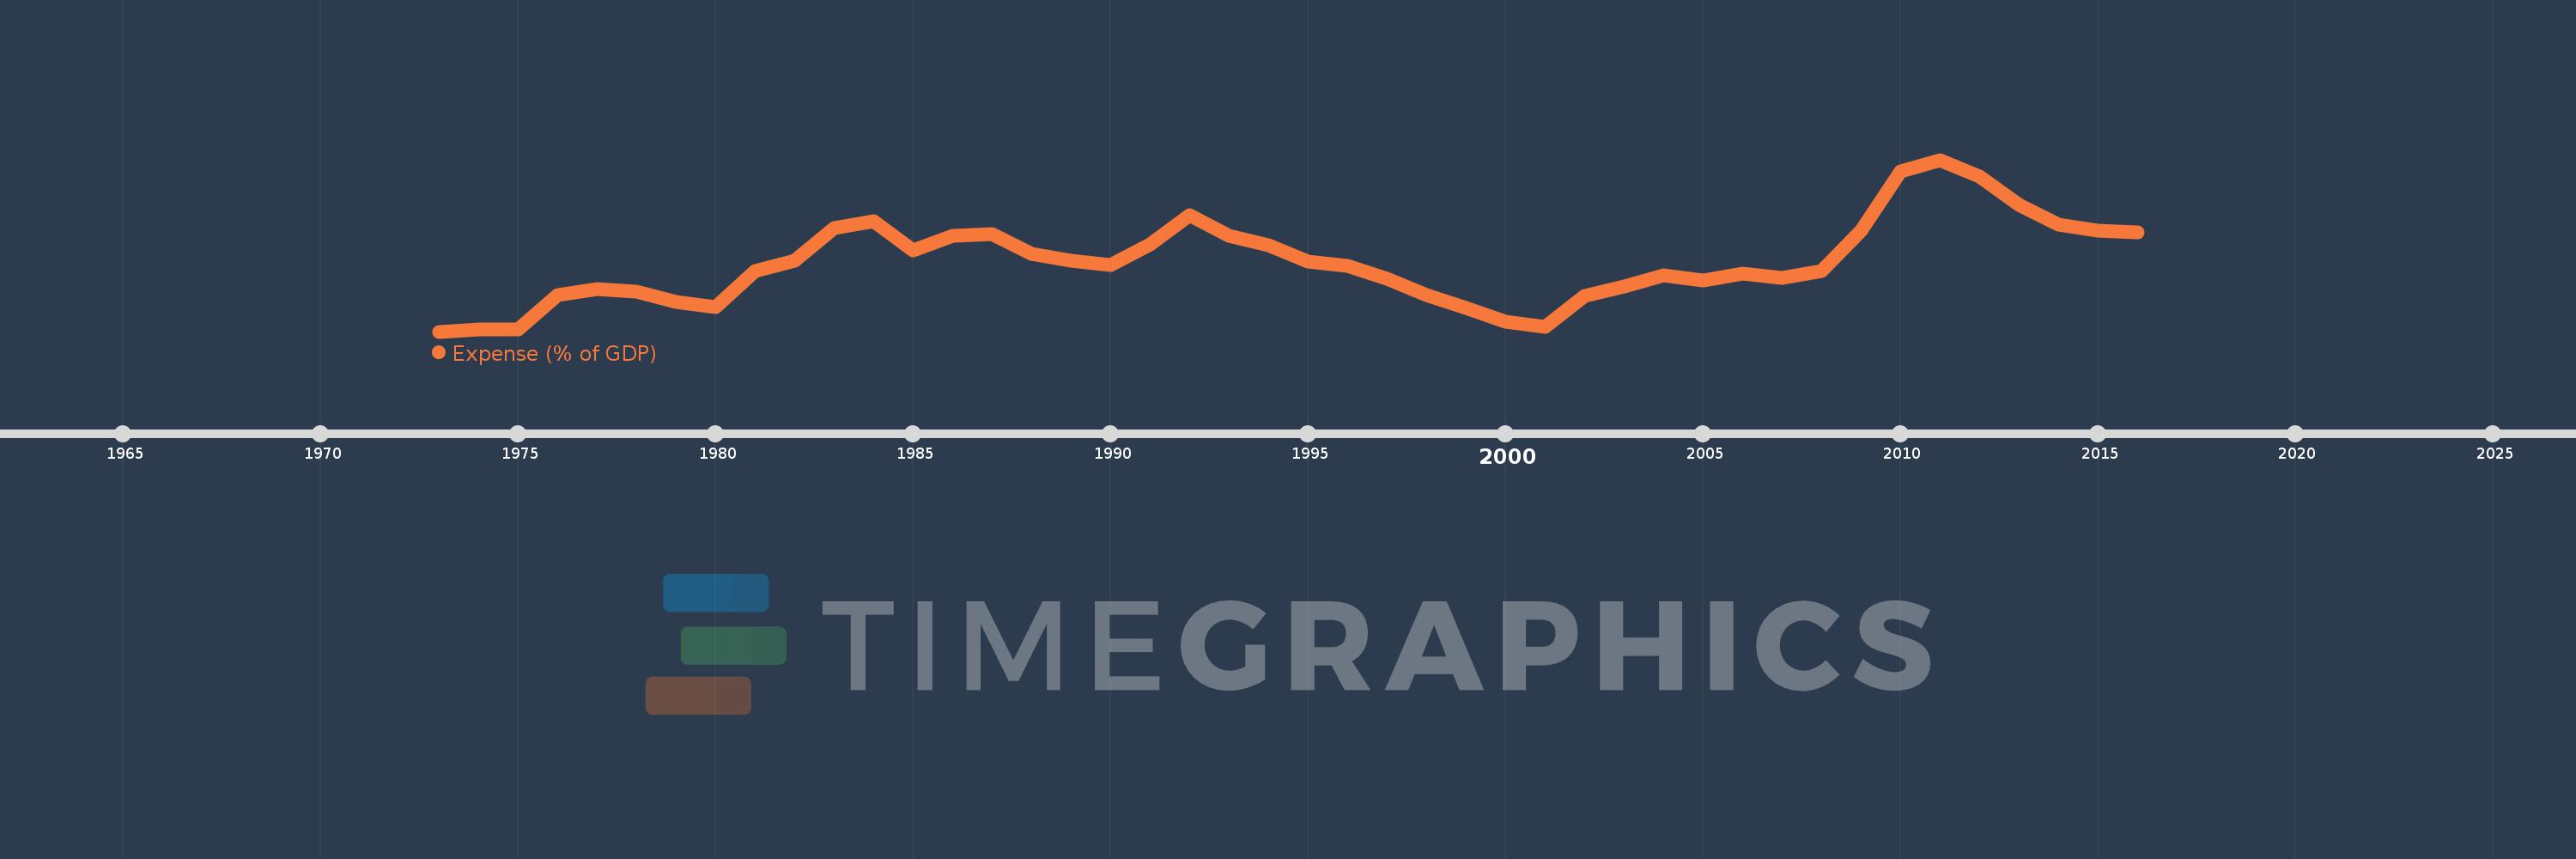
Expense (% of GDP)
2016,2015,2014,2013,2012,2011,2010,2009,2008,2007,2006,2005,2004,2003,2002,2001,2000,1999,1998,1997,1996,1995,1994,1993,1992,1991,1990,1989,1988,1987,1986,1985,1984,1983,1982,1981,1980,1979,1978,1977,1976,1975,1974,1973
Cette statistique dans les autres pays:
AfghanistanAlbaniaAlgeriaAngolaAntigua and BarbudaArmeniaAustraliaAustriaAzerbaijanBahamas, TheBahrainBangladeshBarbadosBelarusBelgiumBelizeBeninBhutanBoliviaBosnia and HerzegovinaBotswanaBrazilBulgariaBurkina FasoBurundiCabo VerdeCambodiaCanadaCaribbean small statesCentral African RepublicCentral Europe and the BalticsChileColombiaCongo, Dem. Rep.Congo, Rep.Costa RicaCote d'IvoireCroatiaCyprusCzech RepublicDenmarkDominicaDominican RepublicEarly-demographic dividendEgypt, Arab Rep.El SalvadorEquatorial GuineaEstoniaEthiopiaEuro areaEurope & Central AsiaEurope & Central Asia (excluding high income)Europe & Central Asia (IDA & IBRD countries)European UnionFijiFinlandFranceGambia, TheGeorgiaGermanyGhanaGreeceGrenadaGuatemalaHeavily indebted poor countries (HIPC)High incomeHondurasHong Kong SAR, ChinaHungaryIcelandIDA blendIDA onlyIDA totalIndiaIndonesiaIran, Islamic Rep.IraqIrelandIsraelItalyJamaicaJapanJordanKazakhstanKenyaKiribatiKorea, Rep.KuwaitKyrgyz RepublicLao PDRLatin America & Caribbean Latin America & Caribbean (excluding high income)Latin America & the Caribbean (IDA & IBRD countries)LatviaLeast developed countries: UN classificationLebanonLesothoLiberiaLithuaniaLow incomeLower middle incomeLuxembourgMacao SAR, ChinaMacedonia, FYRMadagascarMalawiMalaysiaMaldivesMaliMaltaMauritiusMexicoMicronesia, Fed. Sts.Middle East & North Africa (excluding high income)Middle East & North Africa (IDA & IBRD countries)MoldovaMongoliaMoroccoMozambiqueMyanmarNamibiaNepalNetherlandsNew ZealandNicaraguaNigeriaNorth AmericaNorwayOECD membersOmanOther small statesPacific island small statesPakistanPanamaPapua New GuineaParaguayPeruPhilippinesPolandPortugalPost-demographic dividendPre-demographic dividendQatarRomaniaRussian FederationRwandaSamoaSan MarinoSao Tome and PrincipeSenegalSerbiaSeychellesSierra LeoneSingaporeSlovak RepublicSloveniaSmall statesSolomon IslandsSouth AfricaSouth AsiaSouth Asia (IDA & IBRD)SpainSri LankaSt. Kitts and NevisSt. LuciaSub-Saharan Africa Sub-Saharan Africa (excluding high income)Sub-Saharan Africa (IDA & IBRD countries)SurinameSwazilandSwedenSwitzerlandSyrian Arab RepublicTajikistanTanzaniaThailandTimor-LesteTogoTrinidad and TobagoTunisiaTurkeyUgandaUkraineUnited Arab EmiratesUnited KingdomUnited StatesUruguayVanuatuVenezuela, RBVietnamWest Bank and GazaWorldYemen, Rep.ZambiaZimbabwe La ligne de temps
Cette échelle de temps montre un graphique de 1973 année à 2016 année North America. Les données jusqu'à 1972 année ne sont pas présentés. Quantité d'observations actuelles selon dates: 44.
Source (désignation):
Les indicateurs du développement mondiale
Source (organisation):
International Monetary Fund, Government Finance Statistics Yearbook and data files, and World Bank and OECD GDP estimates.
Catégories:
Economy & Growth, Public Sector
Dernière mise à jour
23 avr. 2017
Les indicateurs de changement de valeurs selon les années
Minimum:
17.752
1 janv. 1973
Maximum:
25.581
1 janv. 2011
Pour la date d''observation
Valeur
Changement absolu
Le changement par rapport à la valeur précédente
1 janv. 1973
17.752
+17.752
0.0%
1 janv. 1974
17.857
+0.105
0.59%
1 janv. 1975
17.841
-0.015
-0.09%
1 janv. 1976
19.424
+1.583
8.87%
1 janv. 1977
19.689
+0.264
1.36%
1 janv. 1978
19.564
-0.124
-0.63%
1 janv. 1979
19.083
-0.481
-2.46%
1 janv. 1980
18.887
-0.197
-1.03%
1 janv. 1981
20.507
+1.62
8.58%
1 janv. 1982
20.979
+0.472
2.3%
1 janv. 1983
22.455
+1.476
7.04%
1 janv. 1984
22.777
+0.322
1.43%
1 janv. 1985
21.454
-1.323
-5.81%
1 janv. 1986
22.135
+0.681
3.18%
1 janv. 1987
22.18
+0.044
0.2%
1 janv. 1988
21.308
-0.871
-3.93%
1 janv. 1989
20.966
-0.343
-1.61%
1 janv. 1990
20.804
-0.162
-0.77%
1 janv. 1991
21.744
+0.94
4.52%
1 janv. 1992
23.064
+1.321
6.07%
1 janv. 1993
22.106
-0.958
-4.16%
1 janv. 1994
21.705
-0.401
-1.81%
1 janv. 1995
20.957
-0.749
-3.45%
1 janv. 1996
20.744
-0.213
-1.02%
1 janv. 1997
20.164
-0.58
-2.8%
1 janv. 1998
19.421
-0.742
-3.68%
1 janv. 1999
18.81
-0.611
-3.15%
1 janv. 2000
18.21
-0.6
-3.19%
1 janv. 2001
17.956
-0.255
-1.4%
1 janv. 2002
19.374
+1.419
7.9%
1 janv. 2003
19.816
+0.442
2.28%
1 janv. 2004
20.332
+0.516
2.61%
1 janv. 2005
20.066
-0.267
-1.31%
1 janv. 2006
20.395
+0.329
1.64%
1 janv. 2007
20.216
-0.178
-0.88%
1 janv. 2008
20.506
+0.289
1.43%
1 janv. 2009
22.36
+1.854
9.04%
1 janv. 2010
25.063
+2.703
12.09%
1 janv. 2011
25.581
+0.519
2.07%
1 janv. 2012
24.815
-0.766
-3.0%
1 janv. 2013
23.529
-1.286
-5.18%
1 janv. 2014
22.642
-0.886
-3.77%
1 janv. 2015
22.371
-0.272
-1.2%
1 janv. 2016
22.261
-0.11
-0.49%
Classement des pays selon les statistiques actuelles par années


Commentaires: