29
/fr/
fr
AIzaSyAYiBZKx7MnpbEhh9jyipgxe19OcubqV5w
April 1, 2024
209258
New Zealand
NZL
true
2
1
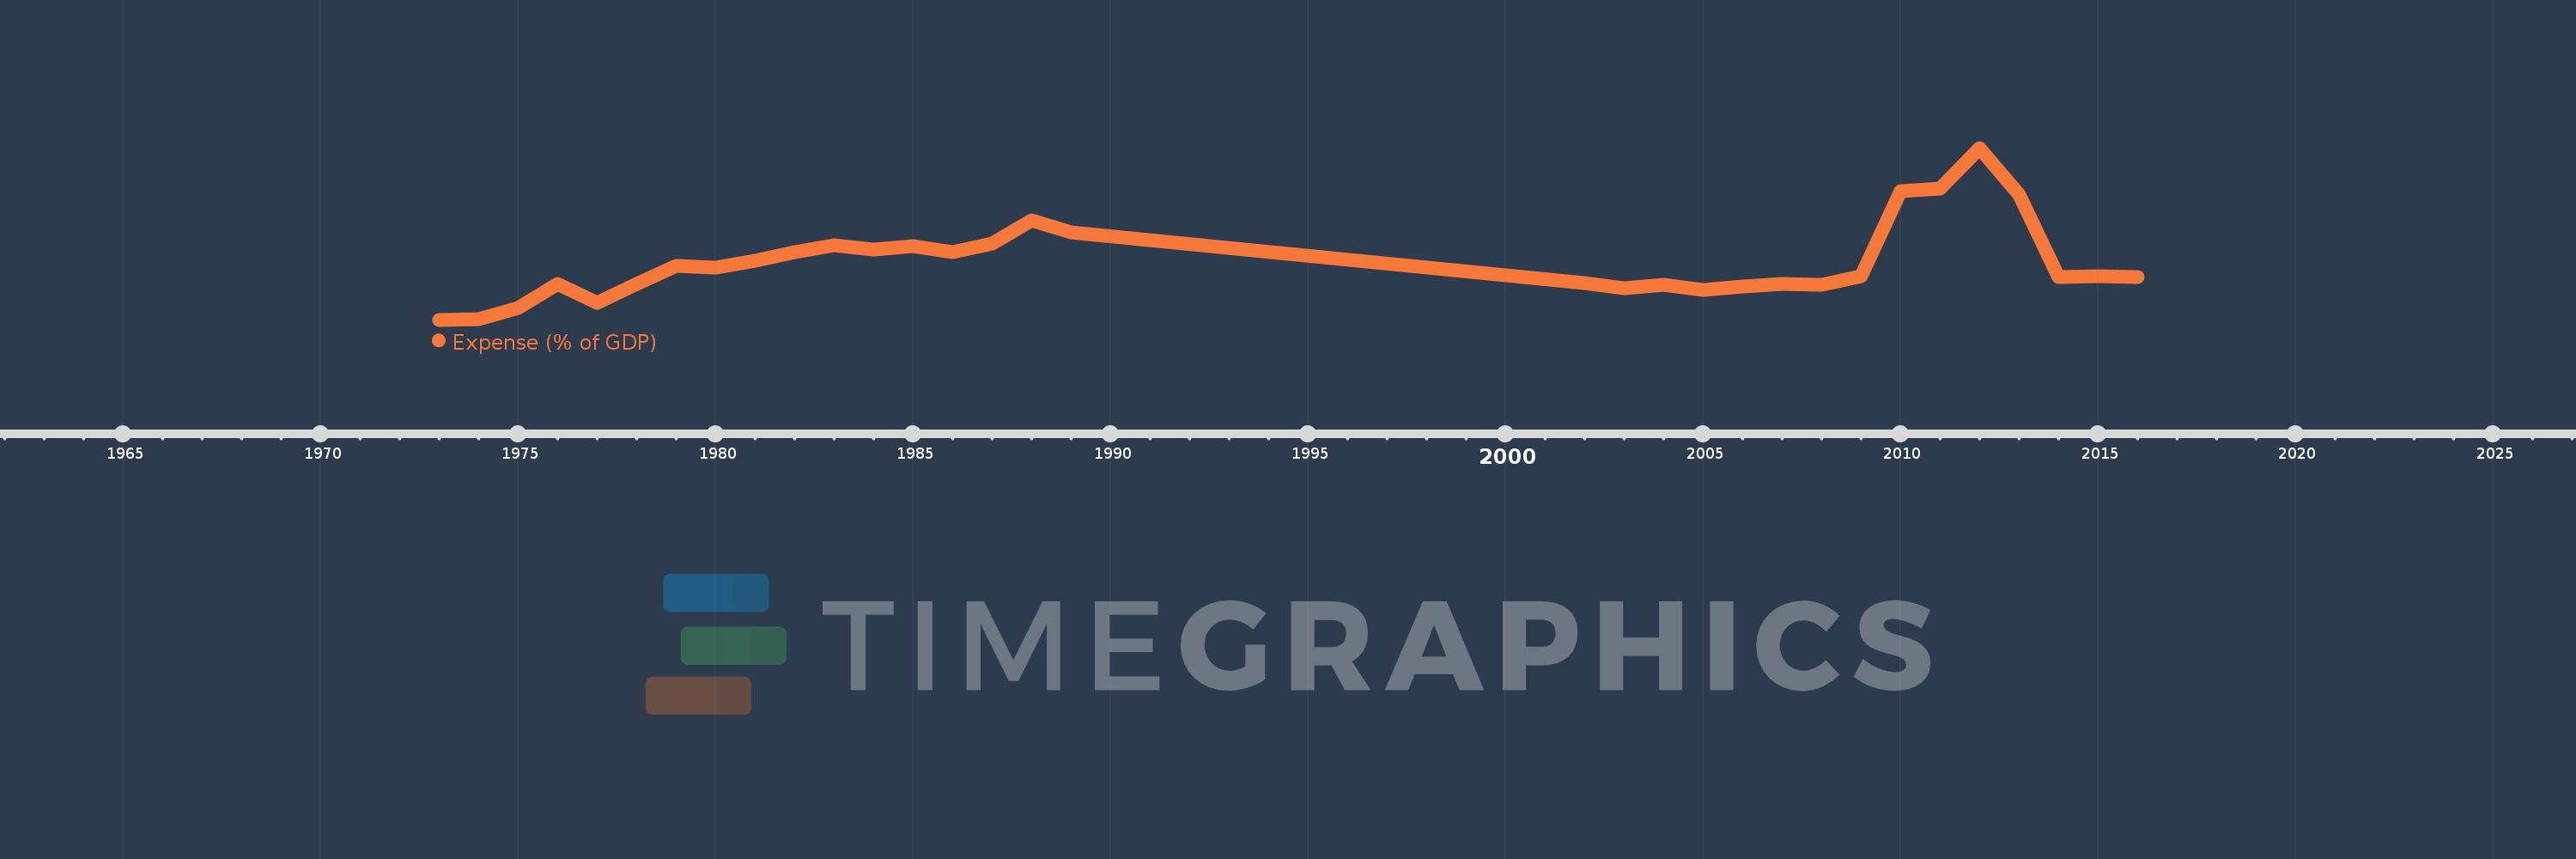
Expense (% of GDP)
2016,2015,2014,2013,2012,2011,2010,2009,2008,2007,2006,2005,2004,2003,2002,1989,1988,1987,1986,1985,1984,1983,1982,1981,1980,1979,1978,1977,1976,1975,1974,1973
Cette statistique dans les autres pays:
AfghanistanAlbaniaAlgeriaAngolaAntigua and BarbudaArmeniaAustraliaAustriaAzerbaijanBahamas, TheBahrainBangladeshBarbadosBelarusBelgiumBelizeBeninBhutanBoliviaBosnia and HerzegovinaBotswanaBrazilBulgariaBurkina FasoBurundiCabo VerdeCambodiaCanadaCaribbean small statesCentral African RepublicCentral Europe and the BalticsChileColombiaCongo, Dem. Rep.Congo, Rep.Costa RicaCote d'IvoireCroatiaCyprusCzech RepublicDenmarkDominicaDominican RepublicEarly-demographic dividendEgypt, Arab Rep.El SalvadorEquatorial GuineaEstoniaEthiopiaEuro areaEurope & Central AsiaEurope & Central Asia (excluding high income)Europe & Central Asia (IDA & IBRD countries)European UnionFijiFinlandFranceGambia, TheGeorgiaGermanyGhanaGreeceGrenadaGuatemalaHeavily indebted poor countries (HIPC)High incomeHondurasHong Kong SAR, ChinaHungaryIcelandIDA blendIDA onlyIDA totalIndiaIndonesiaIran, Islamic Rep.IraqIrelandIsraelItalyJamaicaJapanJordanKazakhstanKenyaKiribatiKorea, Rep.KuwaitKyrgyz RepublicLao PDRLatin America & Caribbean Latin America & Caribbean (excluding high income)Latin America & the Caribbean (IDA & IBRD countries)LatviaLeast developed countries: UN classificationLebanonLesothoLiberiaLithuaniaLow incomeLower middle incomeLuxembourgMacao SAR, ChinaMacedonia, FYRMadagascarMalawiMalaysiaMaldivesMaliMaltaMauritiusMexicoMicronesia, Fed. Sts.Middle East & North Africa (excluding high income)Middle East & North Africa (IDA & IBRD countries)MoldovaMongoliaMoroccoMozambiqueMyanmarNamibiaNepalNetherlandsNew ZealandNicaraguaNigeriaNorth AmericaNorwayOECD membersOmanOther small statesPacific island small statesPakistanPanamaPapua New GuineaParaguayPeruPhilippinesPolandPortugalPost-demographic dividendPre-demographic dividendQatarRomaniaRussian FederationRwandaSamoaSan MarinoSao Tome and PrincipeSenegalSerbiaSeychellesSierra LeoneSingaporeSlovak RepublicSloveniaSmall statesSolomon IslandsSouth AfricaSouth AsiaSouth Asia (IDA & IBRD)SpainSri LankaSt. Kitts and NevisSt. LuciaSub-Saharan Africa Sub-Saharan Africa (excluding high income)Sub-Saharan Africa (IDA & IBRD countries)SurinameSwazilandSwedenSwitzerlandSyrian Arab RepublicTajikistanTanzaniaThailandTimor-LesteTogoTrinidad and TobagoTunisiaTurkeyUgandaUkraineUnited Arab EmiratesUnited KingdomUnited StatesUruguayVanuatuVenezuela, RBVietnamWest Bank and GazaWorldYemen, Rep.ZambiaZimbabwe La ligne de temps
Cette échelle de temps montre un graphique de 1973 année à 2016 année New Zealand. Les données jusqu'à 1972 année ne sont pas présentés. Quantité d'observations actuelles selon dates: 32.
Source (désignation):
Les indicateurs du développement mondiale
Source (organisation):
International Monetary Fund, Government Finance Statistics Yearbook and data files, and World Bank and OECD GDP estimates.
Catégories:
Economy & Growth, Public Sector
Dernière mise à jour
23 avr. 2017
Les indicateurs de changement de valeurs selon les années
Minimum:
25.915
1 janv. 1973
Maximum:
52.059
1 janv. 2012
Pour la date d''observation
Valeur
Changement absolu
Le changement par rapport à la valeur précédente
1 janv. 1973
25.915
+25.915
0.0%
1 janv. 1974
26.062
+0.148
0.57%
1 janv. 1975
27.668
+1.606
6.16%
1 janv. 1976
31.419
+3.751
13.56%
1 janv. 1977
28.502
-2.917
-9.28%
1 janv. 1978
31.39
+2.888
10.13%
1 janv. 1979
34.164
+2.775
8.84%
1 janv. 1980
33.844
-0.32
-0.94%
1 janv. 1981
34.952
+1.109
3.28%
1 janv. 1982
36.221
+1.269
3.63%
1 janv. 1983
37.266
+1.044
2.88%
1 janv. 1984
36.585
-0.681
-1.83%
1 janv. 1985
37.17
+0.585
1.6%
1 janv. 1986
36.141
-1.029
-2.77%
1 janv. 1987
37.469
+1.328
3.68%
1 janv. 1988
41.083
+3.614
9.64%
1 janv. 1989
39.187
-1.896
-4.62%
1 janv. 2002
31.551
-7.635
-19.48%
1 janv. 2003
30.726
-0.826
-2.62%
1 janv. 2004
31.217
+0.492
1.6%
1 janv. 2005
30.436
-0.781
-2.5%
1 janv. 2006
30.986
+0.549
1.81%
1 janv. 2007
31.366
+0.38
1.23%
1 janv. 2008
31.282
-0.084
-0.27%
1 janv. 2009
32.601
+1.319
4.22%
1 janv. 2010
45.488
+12.888
39.53%
1 janv. 2011
45.858
+0.37
0.81%
1 janv. 2012
52.059
+6.201
13.52%
1 janv. 2013
44.96
-7.099
-13.64%
1 janv. 2014
32.438
-12.523
-27.85%
1 janv. 2015
32.578
+0.141
0.43%
1 janv. 2016
32.438
-0.141
-0.43%
Classement des pays selon les statistiques actuelles par années


Commentaires: