29
/fr/
fr
AIzaSyAYiBZKx7MnpbEhh9jyipgxe19OcubqV5w
April 1, 2024
51077
Middle income
MIC
false
2
1
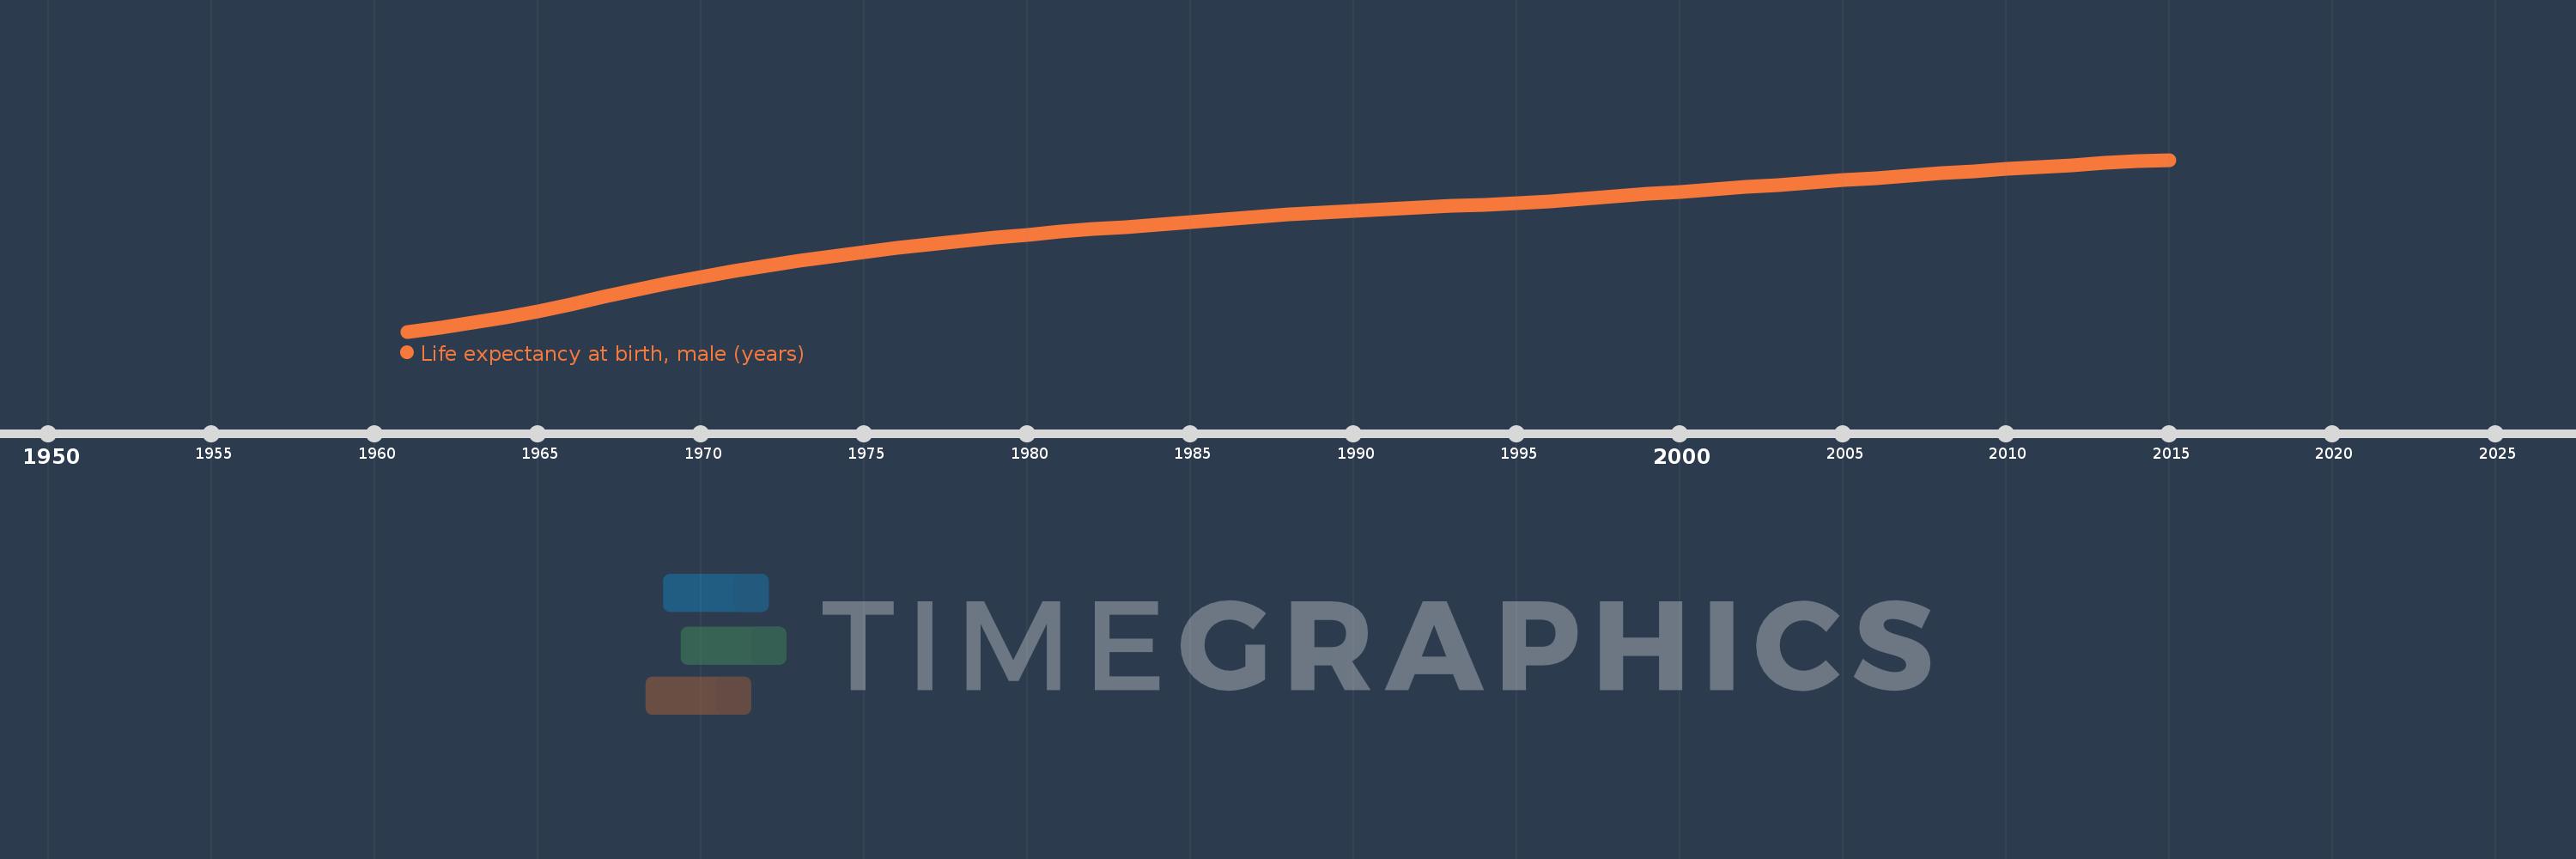
Life expectancy at birth, male (years)
2015,2014,2013,2012,2011,2010,2009,2008,2007,2006,2005,2004,2003,2002,2001,2000,1999,1998,1997,1996,1995,1994,1993,1992,1991,1990,1989,1988,1987,1986,1985,1984,1983,1982,1981,1980,1979,1978,1977,1976,1975,1974,1973,1972,1971,1970,1969,1968,1967,1966,1965,1964,1963,1962,1961
Cette statistique dans les autres pays:
AfghanistanAlbaniaAlgeriaAngolaAntigua and BarbudaArab WorldArgentinaArmeniaArubaAustraliaAustriaAzerbaijanBahamas, TheBahrainBangladeshBarbadosBelarusBelgiumBelizeBeninBermudaBhutanBoliviaBosnia and HerzegovinaBotswanaBrazilBrunei DarussalamBulgariaBurkina FasoBurundiCabo VerdeCambodiaCameroonCanadaCaribbean small statesCentral African RepublicCentral Europe and the BalticsChadChannel IslandsChileChinaColombiaComorosCongo, Dem. Rep.Congo, Rep.Costa RicaCote d'IvoireCroatiaCubaCuracaoCyprusCzech RepublicDenmarkDjiboutiDominicaDominican RepublicEarly-demographic dividendEast Asia & PacificEast Asia & Pacific (excluding high income)East Asia & Pacific (IDA & IBRD countries)EcuadorEgypt, Arab Rep.El SalvadorEquatorial GuineaEritreaEstoniaEthiopiaEuro areaEurope & Central AsiaEurope & Central Asia (excluding high income)Europe & Central Asia (IDA & IBRD countries)European UnionFaroe IslandsFijiFinlandFragile and conflict affected situationsFranceFrench PolynesiaGabonGambia, TheGeorgiaGermanyGhanaGreeceGreenlandGrenadaGuamGuatemalaGuineaGuinea-BissauGuyanaHaitiHeavily indebted poor countries (HIPC)High incomeHondurasHong Kong SAR, ChinaHungaryIBRD onlyIcelandIDA & IBRD totalIDA blendIDA onlyIDA totalIndiaIndonesiaIran, Islamic Rep.IraqIrelandIsle of ManIsraelItalyJamaicaJapanJordanKazakhstanKenyaKiribatiKorea, Dem. People’s Rep.Korea, Rep.KosovoKuwaitKyrgyz RepublicLao PDRLate-demographic dividendLatin America & Caribbean Latin America & Caribbean (excluding high income)Latin America & the Caribbean (IDA & IBRD countries)LatviaLeast developed countries: UN classificationLebanonLesothoLiberiaLibyaLiechtensteinLithuaniaLow & middle incomeLow incomeLower middle incomeLuxembourgMacao SAR, ChinaMacedonia, FYRMadagascarMalawiMalaysiaMaldivesMaliMaltaMarshall IslandsMauritaniaMauritiusMexicoMicronesia, Fed. Sts.Middle East & North AfricaMiddle East & North Africa (excluding high income)Middle East & North Africa (IDA & IBRD countries)Middle incomeMoldovaMongoliaMontenegroMoroccoMozambiqueMyanmarNamibiaNepalNetherlandsNew CaledoniaNew ZealandNicaraguaNigerNigeriaNorth AmericaNorwayOECD membersOmanOther small statesPacific island small statesPakistanPalauPanamaPapua New GuineaParaguayPeruPhilippinesPolandPortugalPost-demographic dividendPre-demographic dividendPuerto RicoQatarRomaniaRussian FederationRwandaSamoaSan MarinoSao Tome and PrincipeSaudi ArabiaSenegalSerbiaSeychellesSierra LeoneSingaporeSint Maarten (Dutch part)Slovak RepublicSloveniaSmall statesSolomon IslandsSomaliaSouth AfricaSouth AsiaSouth Asia (IDA & IBRD)South SudanSpainSri LankaSt. Kitts and NevisSt. LuciaSt. Martin (French part)St. Vincent and the GrenadinesSub-Saharan Africa Sub-Saharan Africa (excluding high income)Sub-Saharan Africa (IDA & IBRD countries)SudanSurinameSwazilandSwedenSwitzerlandSyrian Arab RepublicTajikistanTanzaniaThailandTimor-LesteTogoTongaTrinidad and TobagoTunisiaTurkeyTurkmenistanUgandaUkraineUnited Arab EmiratesUnited KingdomUnited StatesUpper middle incomeUruguayUzbekistanVanuatuVenezuela, RBVietnamVirgin Islands (U.S.)West Bank and GazaWorldYemen, Rep.ZambiaZimbabwe La ligne de temps
Cette échelle de temps montre un graphique de 1961 année à 2015 année Middle income. Les données jusqu'à 1960 année ne sont pas présentés. Quantité d'observations actuelles selon dates: 55.
Source (désignation):
Les indicateurs du développement mondiale
Source (organisation):
(1) United Nations Population Division. World Population Prospects, (2) Census reports and other statistical publications from national statistical offices, (3) Eurostat: Demographic Statistics, (4) United Nations Statistical Division. Population and Vital Statistics Reprot (various years), (5) U.S. Census Bureau: International Database, and (6) Secretariat of the Pacific Community: Statistics and Demography Programme.
Catégories:
Health, Gender, Social Development
Dernière mise à jour
23 avr. 2017
Les indicateurs de changement de valeurs selon les années
Minimum:
46.336
1 janv. 1961
Maximum:
68.678
1 janv. 2015
Pour la date d''observation
Valeur
Changement absolu
Le changement par rapport à la valeur précédente
1 janv. 1961
46.336
+46.336
0.0%
1 janv. 1962
46.873
+0.537
1.16%
1 janv. 1963
47.481
+0.608
1.3%
1 janv. 1964
48.186
+0.705
1.48%
1 janv. 1965
49.002
+0.816
1.69%
1 janv. 1966
49.898
+0.897
1.83%
1 janv. 1967
50.834
+0.935
1.87%
1 janv. 1968
51.763
+0.929
1.83%
1 janv. 1969
52.65
+0.888
1.71%
1 janv. 1970
53.463
+0.813
1.54%
1 janv. 1971
54.204
+0.741
1.39%
1 janv. 1972
54.886
+0.682
1.26%
1 janv. 1973
55.512
+0.626
1.14%
1 janv. 1974
56.117
+0.604
1.09%
1 janv. 1975
56.685
+0.569
1.01%
1 janv. 1976
57.201
+0.515
0.91%
1 janv. 1977
57.7
+0.499
0.87%
1 janv. 1978
58.152
+0.452
0.78%
1 janv. 1979
58.578
+0.426
0.73%
1 janv. 1980
58.947
+0.369
0.63%
1 janv. 1981
59.298
+0.351
0.6%
1 janv. 1982
59.63
+0.332
0.56%
1 janv. 1983
59.961
+0.331
0.56%
1 janv. 1984
60.26
+0.299
0.5%
1 janv. 1985
60.54
+0.28
0.46%
1 janv. 1986
60.873
+0.333
0.55%
1 janv. 1987
61.243
+0.37
0.61%
1 janv. 1988
61.537
+0.294
0.48%
1 janv. 1989
61.805
+0.269
0.44%
1 janv. 1990
62.05
+0.244
0.4%
1 janv. 1991
62.286
+0.236
0.38%
1 janv. 1992
62.509
+0.223
0.36%
1 janv. 1993
62.688
+0.179
0.29%
1 janv. 1994
62.811
+0.122
0.19%
1 janv. 1995
62.998
+0.188
0.3%
1 janv. 1996
63.267
+0.268
0.43%
1 janv. 1997
63.58
+0.313
0.49%
1 janv. 1998
63.922
+0.342
0.54%
1 janv. 1999
64.238
+0.316
0.49%
1 janv. 2000
64.519
+0.281
0.44%
1 janv. 2001
64.813
+0.293
0.45%
1 janv. 2002
65.133
+0.32
0.49%
1 janv. 2003
65.429
+0.296
0.45%
1 janv. 2004
65.735
+0.306
0.47%
1 janv. 2005
66.04
+0.305
0.46%
1 janv. 2006
66.318
+0.278
0.42%
1 janv. 2007
66.63
+0.312
0.47%
1 janv. 2008
66.919
+0.289
0.43%
1 janv. 2009
67.182
+0.263
0.39%
1 janv. 2010
67.466
+0.284
0.42%
1 janv. 2011
67.72
+0.253
0.38%
1 janv. 2012
67.981
+0.261
0.39%
1 janv. 2013
68.233
+0.253
0.37%
1 janv. 2014
68.46
+0.226
0.33%
1 janv. 2015
68.678
+0.218
0.32%
Classement des pays selon les statistiques actuelles par années


Commentaires: