29
/fr/
fr
AIzaSyAYiBZKx7MnpbEhh9jyipgxe19OcubqV5w
April 1, 2024
167725
Kenya
KEN
true
2
1
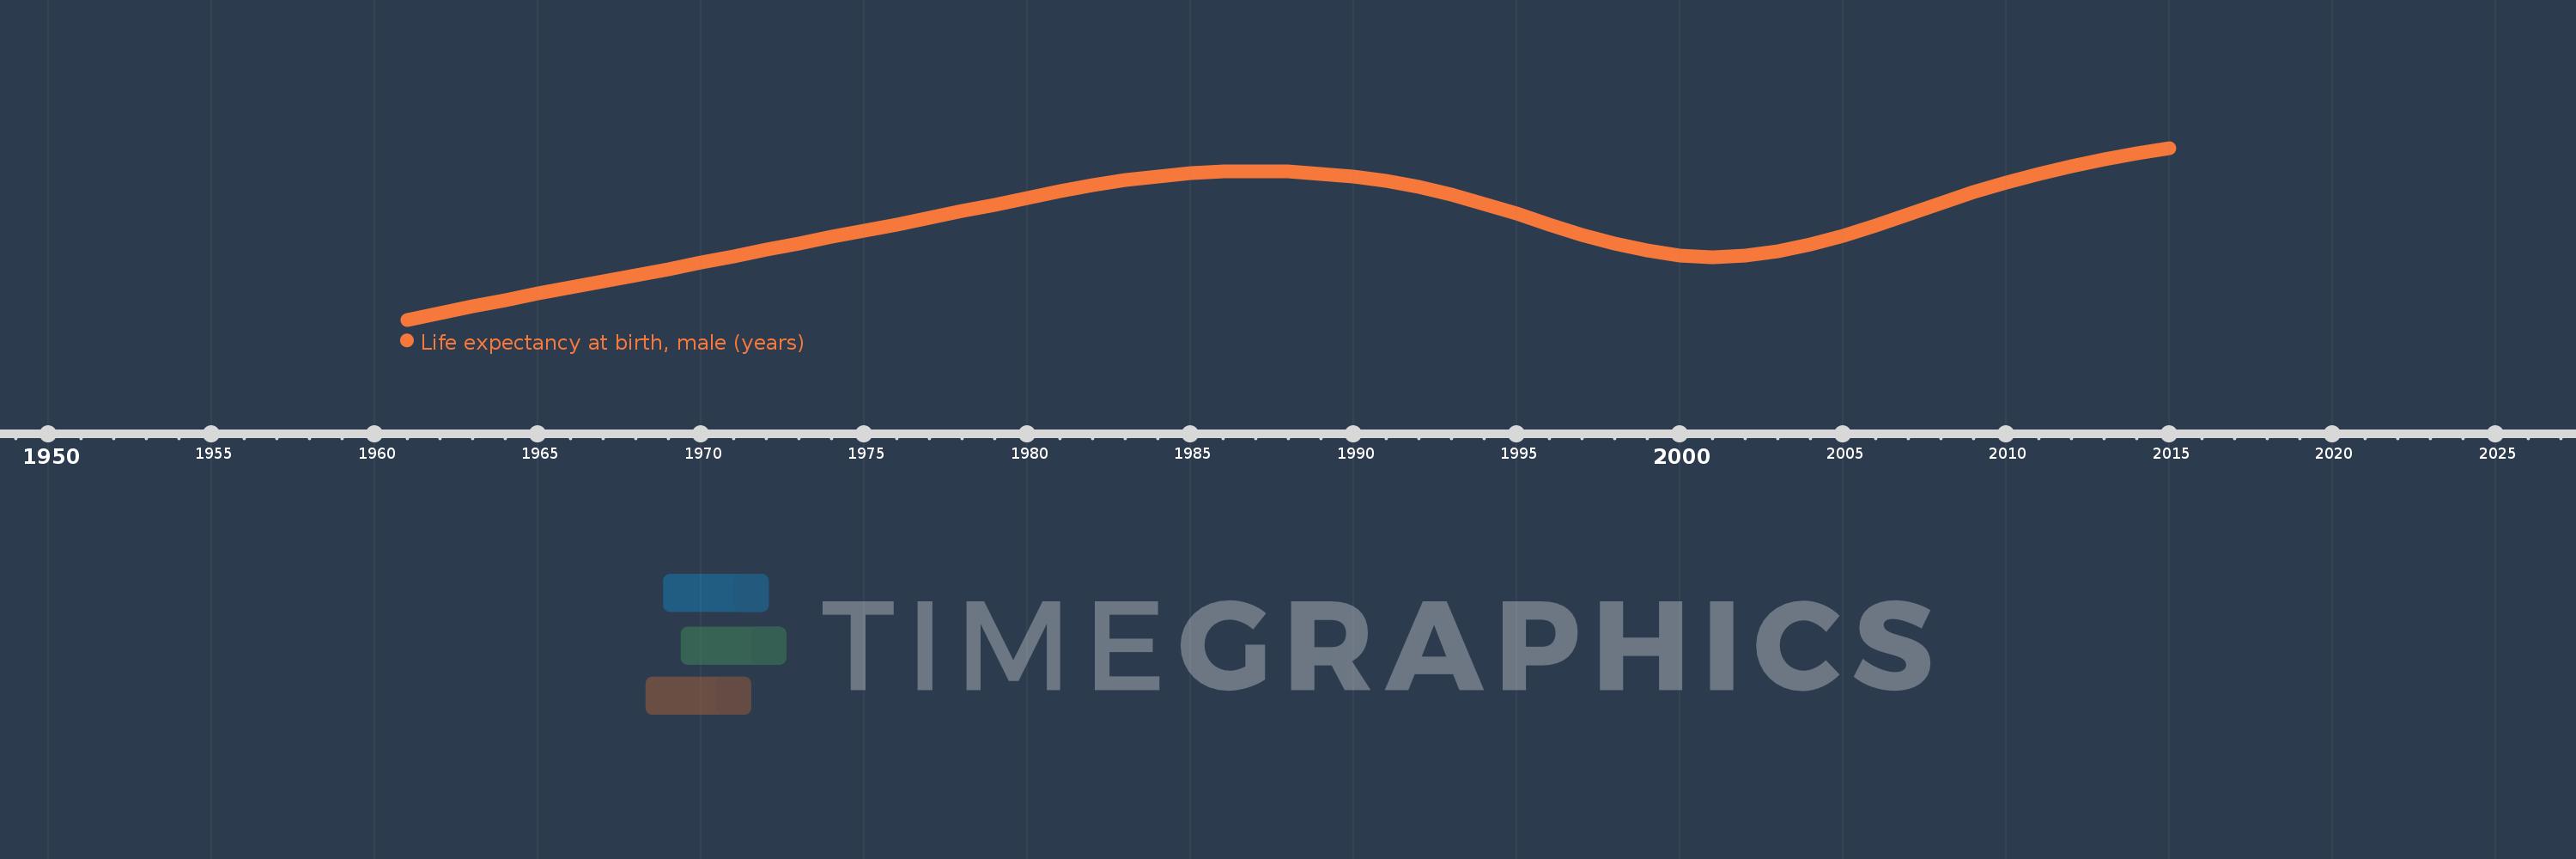
Life expectancy at birth, male (years)
2015,2014,2013,2012,2011,2010,2009,2008,2007,2006,2005,2004,2003,2002,2001,2000,1999,1998,1997,1996,1995,1994,1993,1992,1991,1990,1989,1988,1987,1986,1985,1984,1983,1982,1981,1980,1979,1978,1977,1976,1975,1974,1973,1972,1971,1970,1969,1968,1967,1966,1965,1964,1963,1962,1961
Cette statistique dans les autres pays:
AfghanistanAlbaniaAlgeriaAngolaAntigua and BarbudaArab WorldArgentinaArmeniaArubaAustraliaAustriaAzerbaijanBahamas, TheBahrainBangladeshBarbadosBelarusBelgiumBelizeBeninBermudaBhutanBoliviaBosnia and HerzegovinaBotswanaBrazilBrunei DarussalamBulgariaBurkina FasoBurundiCabo VerdeCambodiaCameroonCanadaCaribbean small statesCentral African RepublicCentral Europe and the BalticsChadChannel IslandsChileChinaColombiaComorosCongo, Dem. Rep.Congo, Rep.Costa RicaCote d'IvoireCroatiaCubaCuracaoCyprusCzech RepublicDenmarkDjiboutiDominicaDominican RepublicEarly-demographic dividendEast Asia & PacificEast Asia & Pacific (excluding high income)East Asia & Pacific (IDA & IBRD countries)EcuadorEgypt, Arab Rep.El SalvadorEquatorial GuineaEritreaEstoniaEthiopiaEuro areaEurope & Central AsiaEurope & Central Asia (excluding high income)Europe & Central Asia (IDA & IBRD countries)European UnionFaroe IslandsFijiFinlandFragile and conflict affected situationsFranceFrench PolynesiaGabonGambia, TheGeorgiaGermanyGhanaGreeceGreenlandGrenadaGuamGuatemalaGuineaGuinea-BissauGuyanaHaitiHeavily indebted poor countries (HIPC)High incomeHondurasHong Kong SAR, ChinaHungaryIBRD onlyIcelandIDA & IBRD totalIDA blendIDA onlyIDA totalIndiaIndonesiaIran, Islamic Rep.IraqIrelandIsle of ManIsraelItalyJamaicaJapanJordanKazakhstanKenyaKiribatiKorea, Dem. People’s Rep.Korea, Rep.KosovoKuwaitKyrgyz RepublicLao PDRLate-demographic dividendLatin America & Caribbean Latin America & Caribbean (excluding high income)Latin America & the Caribbean (IDA & IBRD countries)LatviaLeast developed countries: UN classificationLebanonLesothoLiberiaLibyaLiechtensteinLithuaniaLow & middle incomeLow incomeLower middle incomeLuxembourgMacao SAR, ChinaMacedonia, FYRMadagascarMalawiMalaysiaMaldivesMaliMaltaMarshall IslandsMauritaniaMauritiusMexicoMicronesia, Fed. Sts.Middle East & North AfricaMiddle East & North Africa (excluding high income)Middle East & North Africa (IDA & IBRD countries)Middle incomeMoldovaMongoliaMontenegroMoroccoMozambiqueMyanmarNamibiaNepalNetherlandsNew CaledoniaNew ZealandNicaraguaNigerNigeriaNorth AmericaNorwayOECD membersOmanOther small statesPacific island small statesPakistanPalauPanamaPapua New GuineaParaguayPeruPhilippinesPolandPortugalPost-demographic dividendPre-demographic dividendPuerto RicoQatarRomaniaRussian FederationRwandaSamoaSan MarinoSao Tome and PrincipeSaudi ArabiaSenegalSerbiaSeychellesSierra LeoneSingaporeSint Maarten (Dutch part)Slovak RepublicSloveniaSmall statesSolomon IslandsSomaliaSouth AfricaSouth AsiaSouth Asia (IDA & IBRD)South SudanSpainSri LankaSt. Kitts and NevisSt. LuciaSt. Martin (French part)St. Vincent and the GrenadinesSub-Saharan Africa Sub-Saharan Africa (excluding high income)Sub-Saharan Africa (IDA & IBRD countries)SudanSurinameSwazilandSwedenSwitzerlandSyrian Arab RepublicTajikistanTanzaniaThailandTimor-LesteTogoTongaTrinidad and TobagoTunisiaTurkeyTurkmenistanUgandaUkraineUnited Arab EmiratesUnited KingdomUnited StatesUpper middle incomeUruguayUzbekistanVanuatuVenezuela, RBVietnamVirgin Islands (U.S.)West Bank and GazaWorldYemen, Rep.ZambiaZimbabwe La ligne de temps
Cette échelle de temps montre un graphique de 1961 année à 2015 année Kenya. Les données jusqu'à 1960 année ne sont pas présentés. Quantité d'observations actuelles selon dates: 55.
Source (désignation):
Les indicateurs du développement mondiale
Source (organisation):
(1) United Nations Population Division. World Population Prospects, (2) Census reports and other statistical publications from national statistical offices, (3) Eurostat: Demographic Statistics, (4) United Nations Statistical Division. Population and Vital Statistics Reprot (various years), (5) U.S. Census Bureau: International Database, and (6) Secretariat of the Pacific Community: Statistics and Demography Programme.
Catégories:
Health, Gender, Social Development
Dernière mise à jour
23 avr. 2017
Les indicateurs de changement de valeurs selon les années
Minimum:
44.479
1 janv. 1961
Maximum:
59.851
1 janv. 2015
Pour la date d''observation
Valeur
Changement absolu
Le changement par rapport à la valeur précédente
1 janv. 1961
44.479
+44.479
0.0%
1 janv. 1962
45.073
+0.594
1.34%
1 janv. 1963
45.662
+0.589
1.31%
1 janv. 1964
46.24
+0.578
1.27%
1 janv. 1965
46.805
+0.565
1.22%
1 janv. 1966
47.359
+0.554
1.18%
1 janv. 1967
47.909
+0.55
1.16%
1 janv. 1968
48.462
+0.553
1.15%
1 janv. 1969
49.024
+0.562
1.16%
1 janv. 1970
49.596
+0.572
1.17%
1 janv. 1971
50.174
+0.578
1.17%
1 janv. 1972
50.755
+0.581
1.16%
1 janv. 1973
51.332
+0.577
1.14%
1 janv. 1974
51.901
+0.569
1.11%
1 janv. 1975
52.462
+0.561
1.08%
1 janv. 1976
53.022
+0.56
1.07%
1 janv. 1977
53.596
+0.574
1.08%
1 janv. 1978
54.186
+0.59
1.1%
1 janv. 1979
54.786
+0.6
1.11%
1 janv. 1980
55.384
+0.598
1.09%
1 janv. 1981
55.959
+0.575
1.04%
1 janv. 1982
56.489
+0.53
0.95%
1 janv. 1983
56.95
+0.461
0.82%
1 janv. 1984
57.321
+0.371
0.65%
1 janv. 1985
57.586
+0.265
0.46%
1 janv. 1986
57.738
+0.152
0.26%
1 janv. 1987
57.778
+0.04
0.07%
1 janv. 1988
57.715
-0.063
-0.11%
1 janv. 1989
57.557
-0.158
-0.27%
1 janv. 1990
57.302
-0.255
-0.44%
1 janv. 1991
56.924
-0.378
-0.66%
1 janv. 1992
56.388
-0.536
-0.94%
1 janv. 1993
55.695
-0.693
-1.23%
1 janv. 1994
54.867
-0.828
-1.49%
1 janv. 1995
53.952
-0.915
-1.67%
1 janv. 1996
53.007
-0.945
-1.75%
1 janv. 1997
52.1
-0.907
-1.71%
1 janv. 1998
51.299
-0.801
-1.54%
1 janv. 1999
50.666
-0.633
-1.23%
1 janv. 2000
50.247
-0.419
-0.83%
1 janv. 2001
50.092
-0.155
-0.31%
1 janv. 2002
50.23
+0.138
0.28%
1 janv. 2003
50.626
+0.396
0.79%
1 janv. 2004
51.237
+0.611
1.21%
1 janv. 2005
52.022
+0.785
1.53%
1 janv. 2006
52.933
+0.911
1.75%
1 janv. 2007
53.915
+0.982
1.86%
1 janv. 2008
54.911
+0.996
1.85%
1 janv. 2009
55.872
+0.961
1.75%
1 janv. 2010
56.758
+0.886
1.59%
1 janv. 2011
57.543
+0.785
1.38%
1 janv. 2012
58.223
+0.68
1.18%
1 janv. 2013
58.824
+0.601
1.03%
1 janv. 2014
59.365
+0.541
0.92%
1 janv. 2015
59.851
+0.486
0.82%
Classement des pays selon les statistiques actuelles par années


Commentaires: