29
/fr/
fr
AIzaSyAYiBZKx7MnpbEhh9jyipgxe19OcubqV5w
April 1, 2024
48575
Middle East & North Africa
MEA
false
2
1
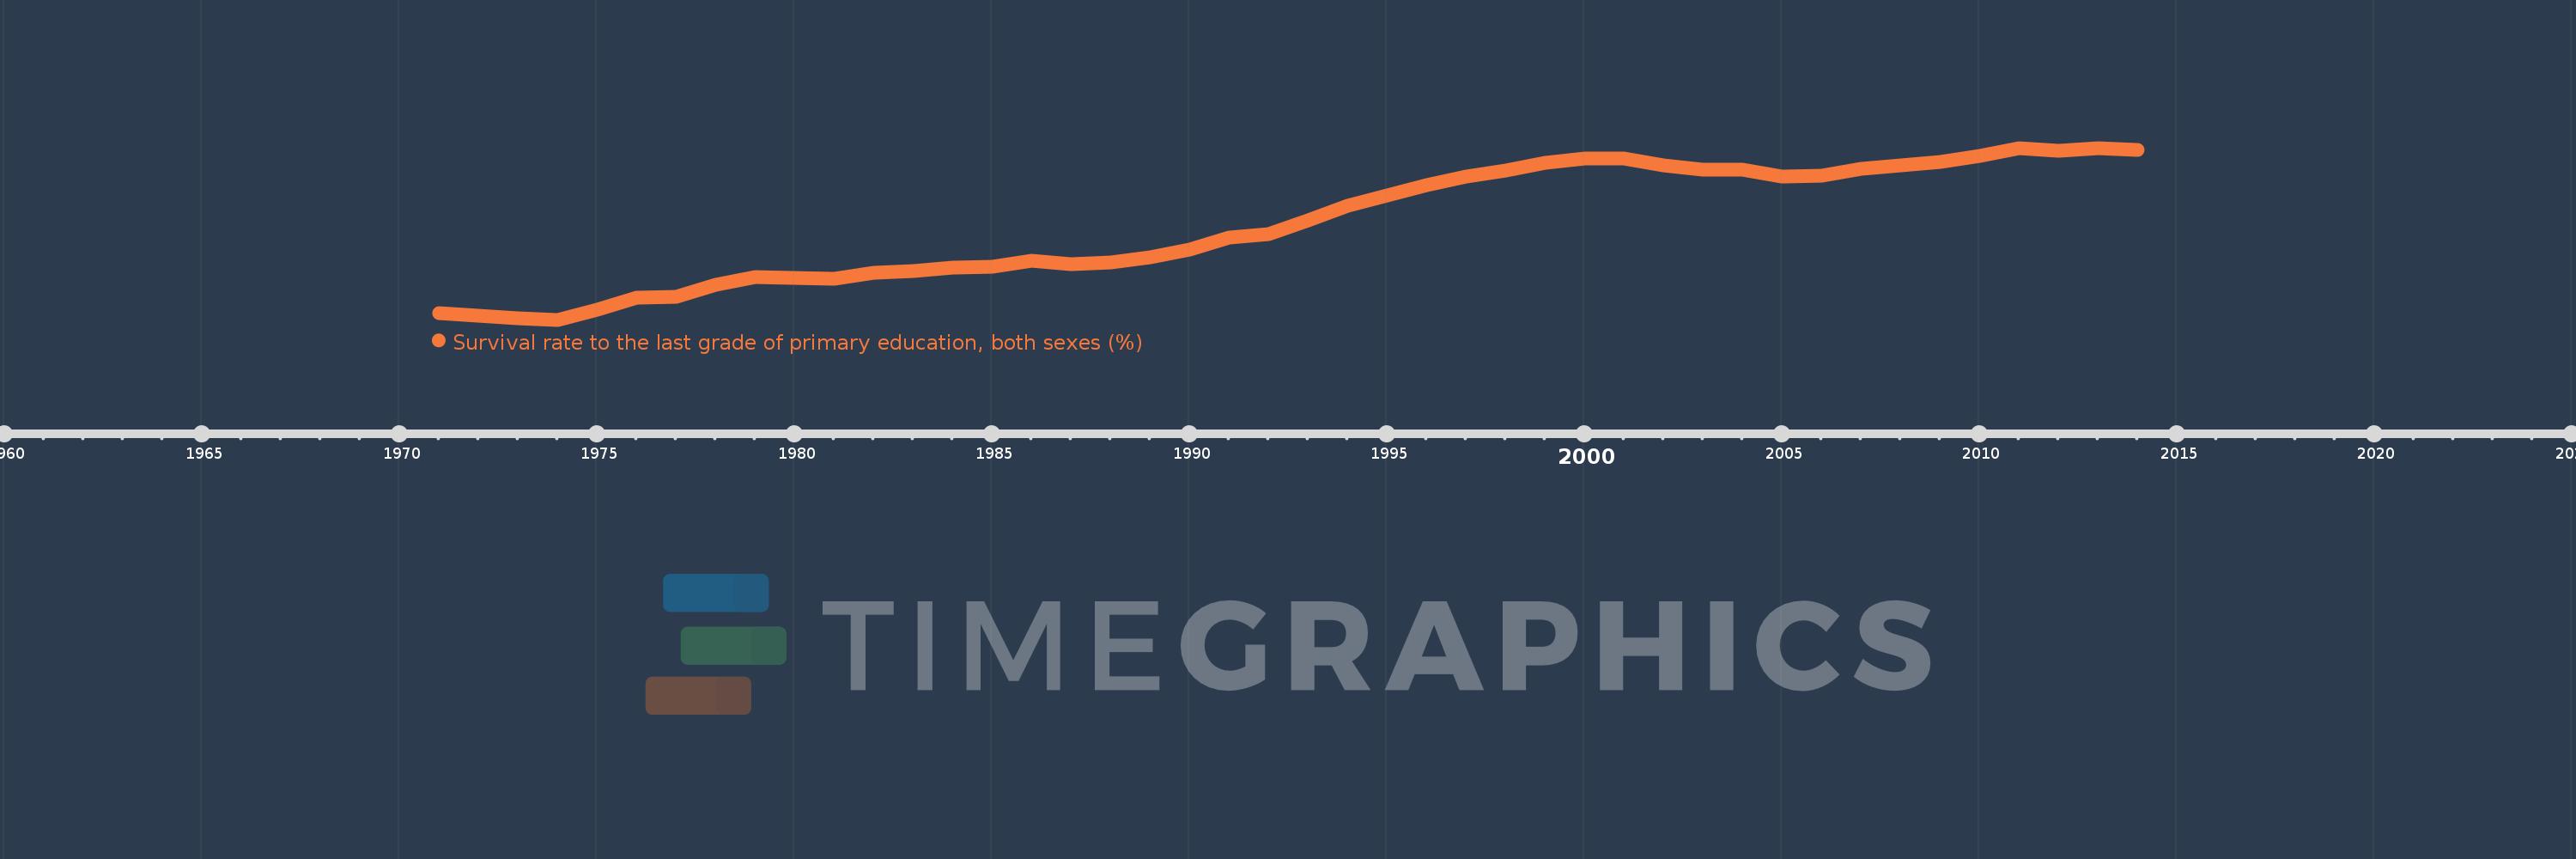
Survival rate to the last grade of primary education, both sexes (%)
2014,2013,2012,2011,2010,2009,2008,2007,2006,2005,2004,2003,2002,2001,2000,1999,1998,1997,1996,1995,1994,1993,1992,1991,1990,1989,1988,1987,1986,1985,1984,1983,1982,1981,1980,1979,1978,1977,1976,1975,1974,1973,1972,1971
Cette statistique dans les autres pays:
AfghanistanAlbaniaAlgeriaAndorraAngolaAntigua and BarbudaArab WorldArgentinaArmeniaArubaAustriaAzerbaijanBahamas, TheBahrainBangladeshBarbadosBelarusBelgiumBelizeBeninBermudaBhutanBoliviaBosnia and HerzegovinaBotswanaBrazilBrunei DarussalamBulgariaBurkina FasoBurundiCabo VerdeCambodiaCameroonCanadaCaribbean small statesCayman IslandsCentral African RepublicCentral Europe and the BalticsChadChileChinaColombiaComorosCongo, Dem. Rep.Congo, Rep.Costa RicaCote d'IvoireCroatiaCubaCyprusCzech RepublicDenmarkDjiboutiDominicaDominican RepublicEarly-demographic dividendEast Asia & PacificEast Asia & Pacific (excluding high income)East Asia & Pacific (IDA & IBRD countries)EcuadorEgypt, Arab Rep.El SalvadorEquatorial GuineaEritreaEstoniaEthiopiaEuro areaEurope & Central AsiaEurope & Central Asia (excluding high income)Europe & Central Asia (IDA & IBRD countries)European UnionFijiFinlandFragile and conflict affected situationsFranceGabonGambia, TheGeorgiaGermanyGhanaGreeceGuatemalaGuineaGuinea-BissauGuyanaHaitiHeavily indebted poor countries (HIPC)High incomeHondurasHong Kong SAR, ChinaHungaryIBRD onlyIcelandIDA & IBRD totalIDA blendIDA onlyIDA totalIndiaIndonesiaIran, Islamic Rep.IraqIsraelItalyJamaicaJapanJordanKazakhstanKenyaKiribatiKorea, Rep.KuwaitKyrgyz RepublicLao PDRLate-demographic dividendLatin America & Caribbean Latin America & Caribbean (excluding high income)Latin America & the Caribbean (IDA & IBRD countries)LatviaLeast developed countries: UN classificationLebanonLesothoLiberiaLibyaLiechtensteinLithuaniaLow & middle incomeLow incomeLower middle incomeLuxembourgMacao SAR, ChinaMacedonia, FYRMadagascarMalawiMalaysiaMaldivesMaliMaltaMarshall IslandsMauritaniaMauritiusMexicoMiddle East & North AfricaMiddle East & North Africa (excluding high income)Middle East & North Africa (IDA & IBRD countries)Middle incomeMoldovaMonacoMongoliaMontenegroMoroccoMozambiqueMyanmarNamibiaNepalNetherlandsNicaraguaNigerNigeriaNorth AmericaNorwayOECD membersOmanOther small statesPacific island small statesPakistanPanamaPapua New GuineaParaguayPeruPhilippinesPolandPortugalPost-demographic dividendPre-demographic dividendQatarRomaniaRussian FederationRwandaSamoaSan MarinoSao Tome and PrincipeSaudi ArabiaSenegalSerbiaSeychellesSierra LeoneSingaporeSlovak RepublicSloveniaSmall statesSolomon IslandsSouth AfricaSouth AsiaSouth Asia (IDA & IBRD)SpainSri LankaSt. Kitts and NevisSt. LuciaSt. Vincent and the GrenadinesSub-Saharan Africa Sub-Saharan Africa (excluding high income)Sub-Saharan Africa (IDA & IBRD countries)SudanSurinameSwazilandSwedenSwitzerlandSyrian Arab RepublicTajikistanTanzaniaThailandTimor-LesteTogoTongaTrinidad and TobagoTunisiaTurkeyUgandaUkraineUnited Arab EmiratesUpper middle incomeUruguayUzbekistanVanuatuVenezuela, RBVietnamWest Bank and GazaWorldYemen, Rep.ZambiaZimbabwe La ligne de temps
Cette échelle de temps montre un graphique de 1971 année à 2014 année Middle East & North Africa. Les données jusqu'à 1970 année ne sont pas présentés. Quantité d'observations actuelles selon dates: 44.
Source (désignation):
Les indicateurs du développement mondiale
Source (organisation):
UNESCO Institute for Statistics
Catégories:
Education
Dernière mise à jour
23 avr. 2017
Les indicateurs de changement de valeurs selon les années
Maximum:
87.917
1 janv. 2013
Pour la date d''observation
Valeur
Changement absolu
Le changement par rapport à la valeur précédente
1 janv. 1971
57.95
+57.95
0.0%
1 janv. 1972
57.45
-0.5
-0.86%
1 janv. 1973
56.929
-0.522
-0.91%
1 janv. 1974
56.7
-0.228
-0.4%
1 janv. 1975
58.45
+1.75
3.09%
1 janv. 1976
60.652
+2.201
3.77%
1 janv. 1977
60.843
+0.192
0.32%
1 janv. 1978
63.121
+2.277
3.74%
1 janv. 1979
64.433
+1.313
2.08%
1 janv. 1980
64.245
-0.188
-0.29%
1 janv. 1981
64.181
-0.064
-0.1%
1 janv. 1982
65.282
+1.101
1.72%
1 janv. 1983
65.557
+0.275
0.42%
1 janv. 1984
66.124
+0.568
0.87%
1 janv. 1985
66.254
+0.13
0.2%
1 janv. 1986
67.49
+1.236
1.87%
1 janv. 1987
66.841
-0.649
-0.96%
1 janv. 1988
67.048
+0.207
0.31%
1 janv. 1989
67.978
+0.93
1.39%
1 janv. 1990
69.408
+1.429
2.1%
1 janv. 1991
71.566
+2.159
3.11%
1 janv. 1992
72.332
+0.765
1.07%
1 janv. 1993
74.743
+2.411
3.33%
1 janv. 1994
77.394
+2.651
3.55%
1 janv. 1995
79.277
+1.883
2.43%
1 janv. 1996
81.177
+1.901
2.4%
1 janv. 1997
82.663
+1.485
1.83%
1 janv. 1998
83.876
+1.214
1.47%
1 janv. 1999
85.278
+1.402
1.67%
1 janv. 2000
85.942
+0.663
0.78%
1 janv. 2001
85.957
+0.015
0.02%
1 janv. 2002
84.799
-1.158
-1.35%
1 janv. 2003
83.921
-0.878
-1.04%
1 janv. 2004
83.94
+0.02
0.02%
1 janv. 2005
82.73
-1.211
-1.44%
1 janv. 2006
82.854
+0.125
0.15%
1 janv. 2007
84.11
+1.255
1.52%
1 janv. 2008
84.76
+0.65
0.77%
1 janv. 2009
85.387
+0.627
0.74%
1 janv. 2010
86.479
+1.092
1.28%
1 janv. 2011
87.904
+1.425
1.65%
1 janv. 2012
87.431
-0.473
-0.54%
1 janv. 2013
87.917
+0.486
0.56%
1 janv. 2014
87.481
-0.436
-0.5%
Classement des pays selon les statistiques actuelles par années


Commentaires: