30
/fr/
AIzaSyAYiBZKx7MnpbEhh9jyipgxe19OcubqV5w
April 1, 2024
274334
Ukraine
UKR
true
2
1
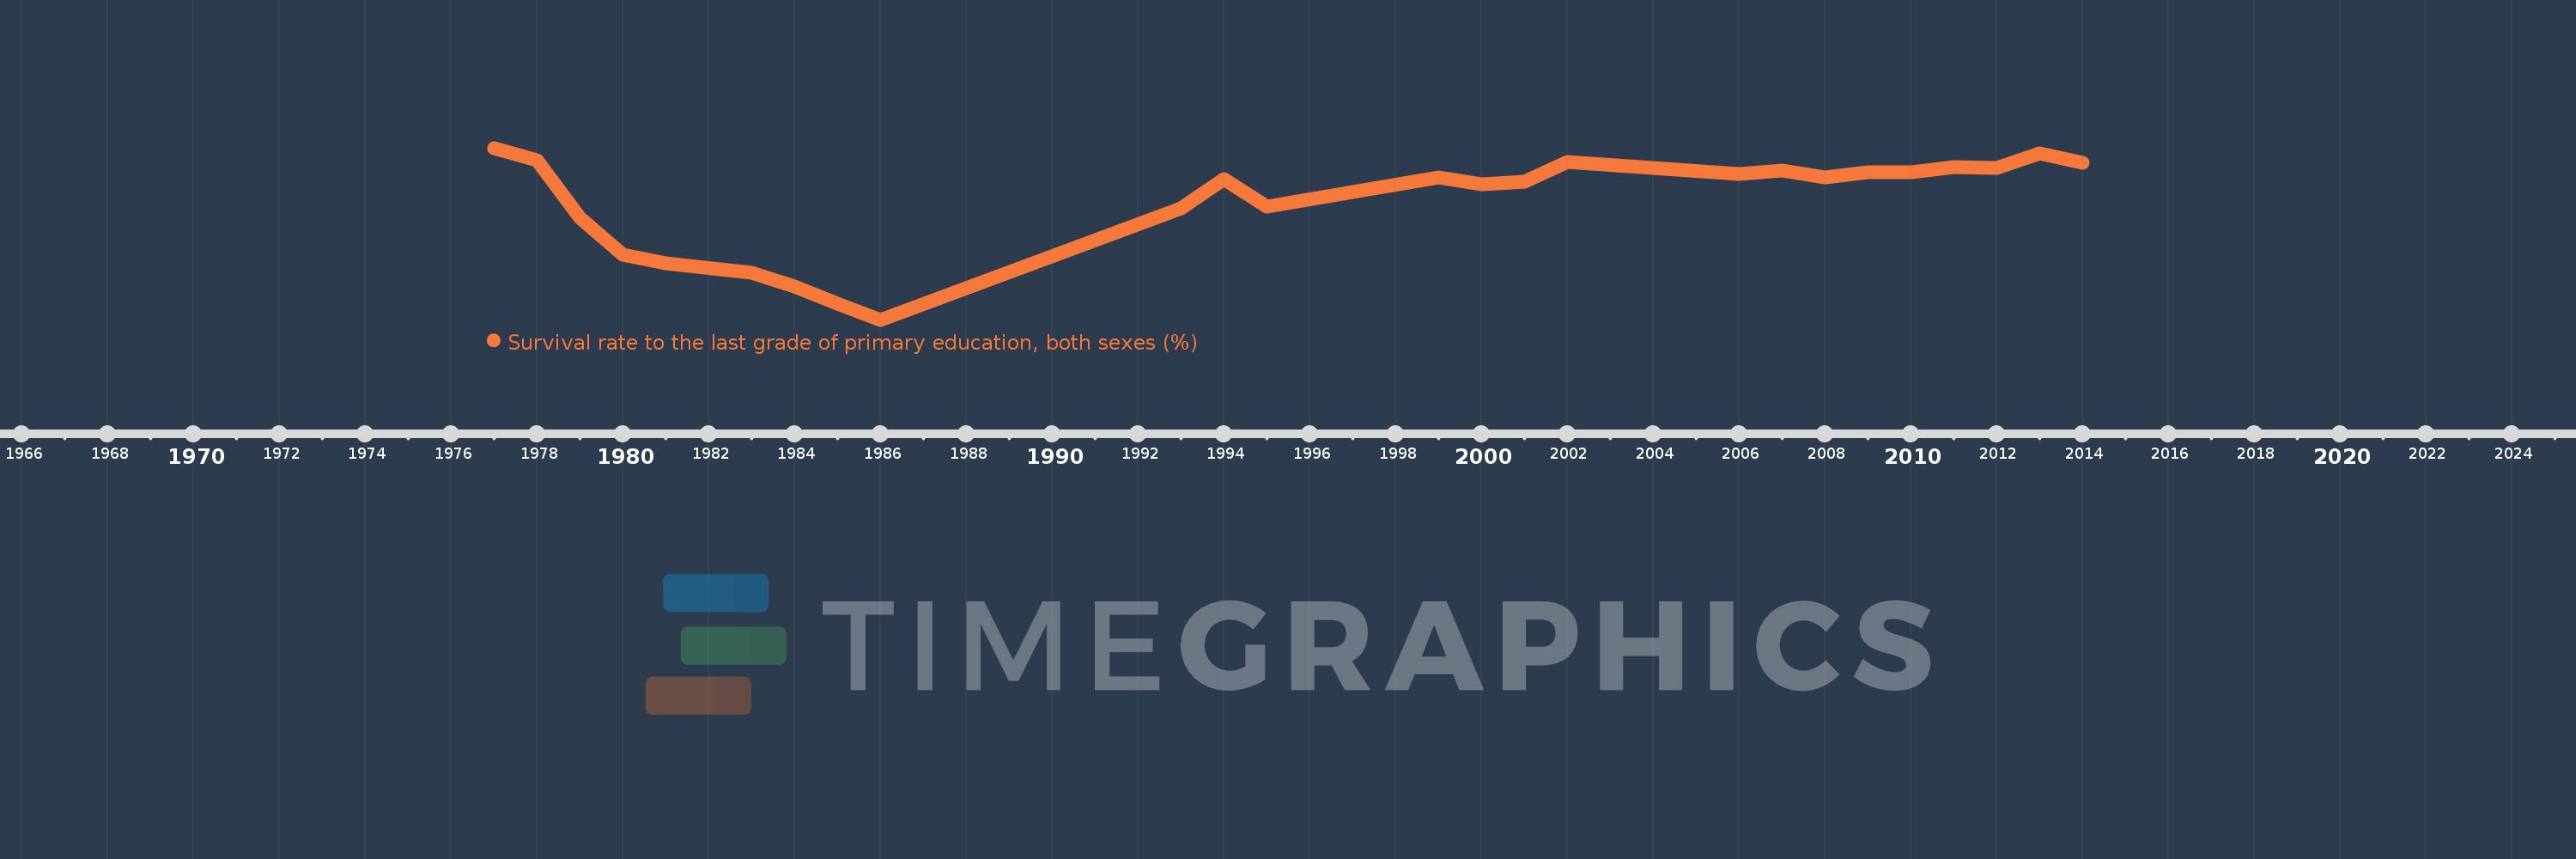
Survival rate to the last grade of primary education, both sexes (%)
2014,2013,2012,2011,2010,2009,2008,2007,2006,2002,2001,2000,1999,1995,1994,1993,1986,1985,1984,1983,1981,1980,1979,1978,1977
