29
/fr/
fr
AIzaSyAYiBZKx7MnpbEhh9jyipgxe19OcubqV5w
April 1, 2024
48289
Middle East & North Africa
MEA
false
2
1
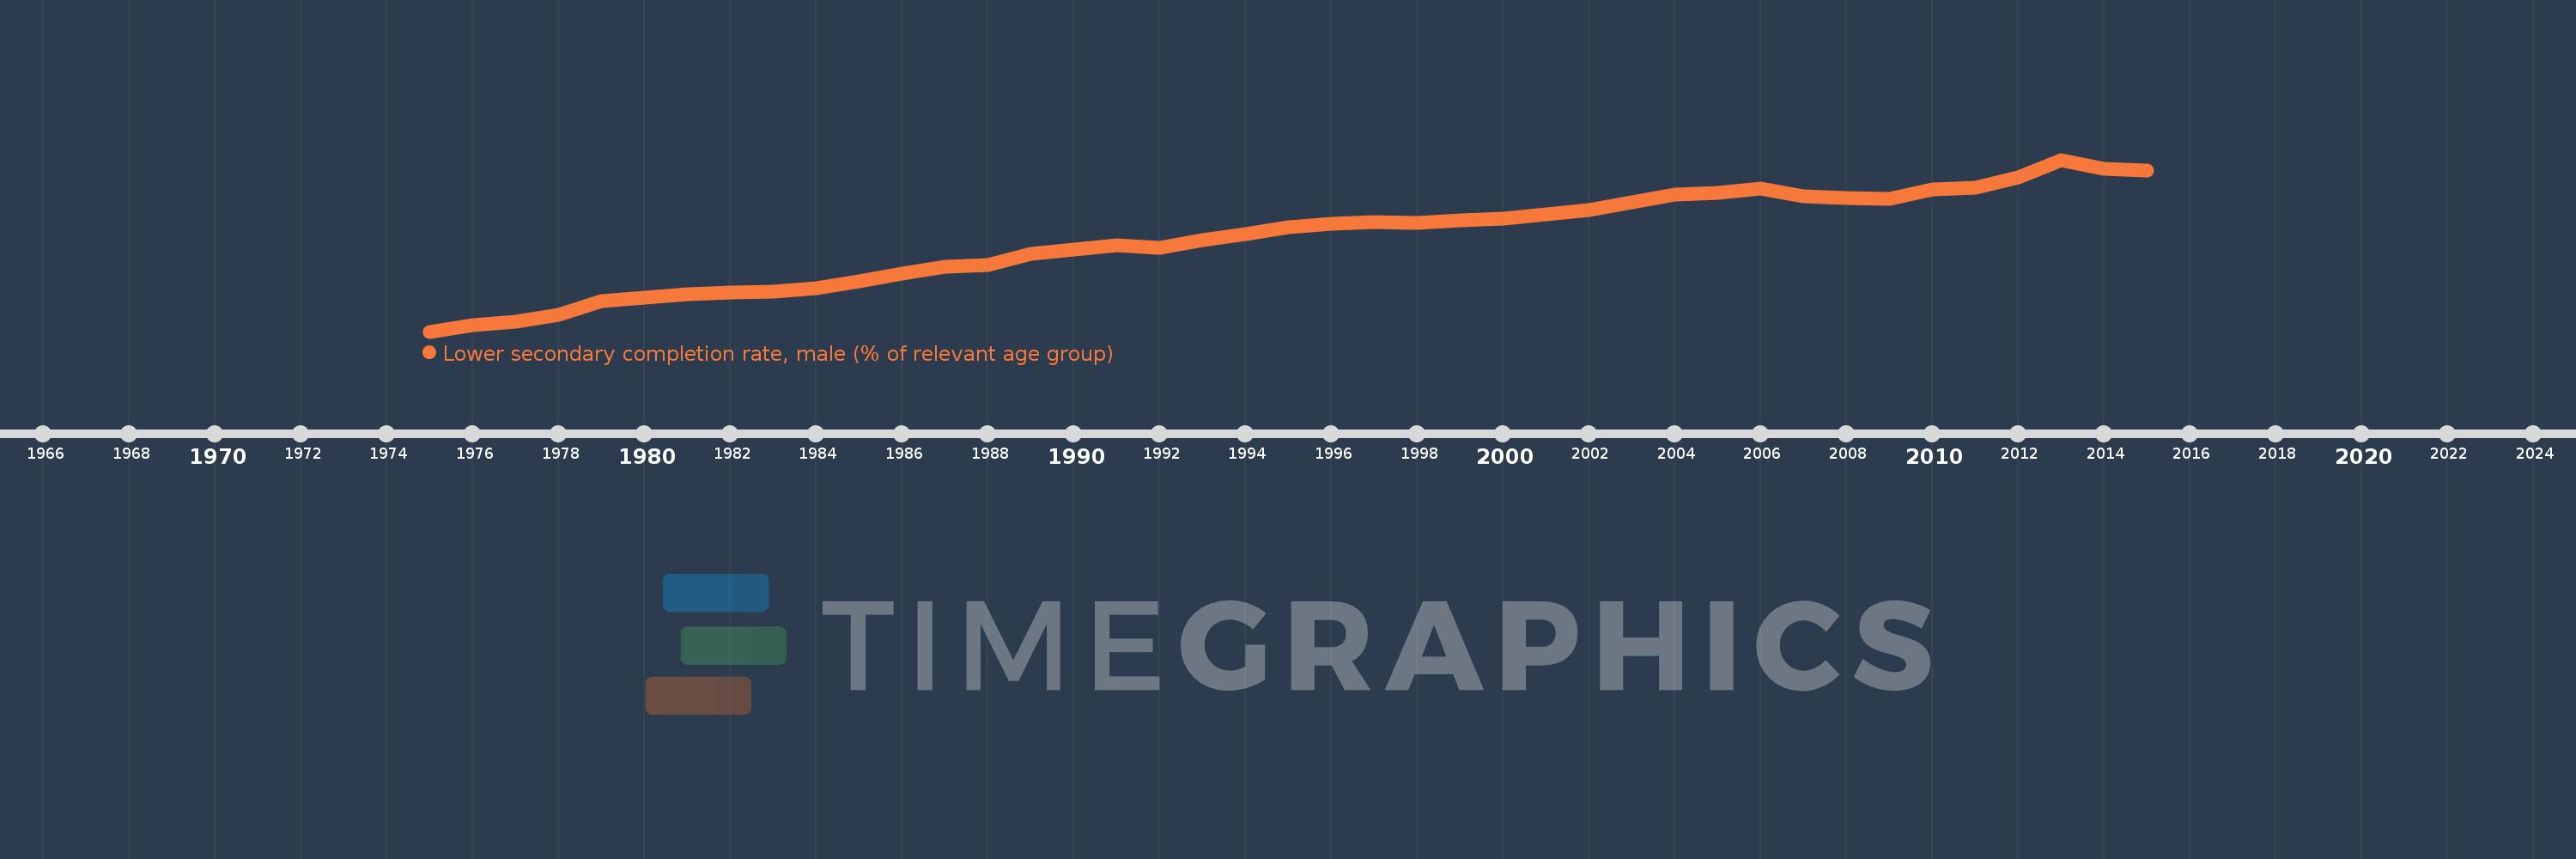
Lower secondary completion rate, male (% of relevant age group)
2015,2014,2013,2012,2011,2010,2009,2008,2007,2006,2005,2004,2003,2002,2001,2000,1999,1998,1997,1996,1995,1994,1993,1992,1991,1990,1989,1988,1987,1986,1985,1984,1983,1982,1981,1980,1979,1978,1977,1976,1975
Cette statistique dans les autres pays:
AfghanistanAlbaniaAlgeriaAngolaAntigua and BarbudaArab WorldArgentinaArmeniaArubaAustriaAzerbaijanBahamas, TheBahrainBangladeshBarbadosBelarusBelgiumBelizeBeninBermudaBhutanBoliviaBosnia and HerzegovinaBotswanaBrunei DarussalamBulgariaBurkina FasoBurundiCabo VerdeCambodiaCameroonCaribbean small statesCentral African RepublicCentral Europe and the BalticsChadChileChinaColombiaComorosCongo, Dem. Rep.Congo, Rep.Costa RicaCote d'IvoireCroatiaCubaCyprusCzech RepublicDenmarkDjiboutiDominicaDominican RepublicEarly-demographic dividendEast Asia & PacificEast Asia & Pacific (excluding high income)East Asia & Pacific (IDA & IBRD countries)EcuadorEgypt, Arab Rep.El SalvadorEquatorial GuineaEritreaEstoniaEthiopiaEuro areaEurope & Central AsiaEurope & Central Asia (excluding high income)Europe & Central Asia (IDA & IBRD countries)European UnionFijiFinlandFragile and conflict affected situationsFranceGabonGambia, TheGeorgiaGermanyGhanaGreeceGrenadaGuatemalaGuineaGuinea-BissauGuyanaHaitiHeavily indebted poor countries (HIPC)High incomeHondurasHong Kong SAR, ChinaHungaryIBRD onlyIcelandIDA & IBRD totalIDA blendIDA onlyIDA totalIndiaIndonesiaIran, Islamic Rep.IraqIrelandIsraelItalyJamaicaJapanJordanKazakhstanKenyaKiribatiKorea, Dem. People’s Rep.Korea, Rep.KuwaitKyrgyz RepublicLao PDRLate-demographic dividendLatin America & Caribbean Latin America & Caribbean (excluding high income)Latin America & the Caribbean (IDA & IBRD countries)LatviaLeast developed countries: UN classificationLebanonLesothoLiberiaLiechtensteinLithuaniaLow & middle incomeLow incomeLower middle incomeLuxembourgMacao SAR, ChinaMacedonia, FYRMadagascarMalawiMaldivesMaliMaltaMarshall IslandsMauritaniaMauritiusMexicoMiddle East & North AfricaMiddle East & North Africa (excluding high income)Middle East & North Africa (IDA & IBRD countries)Middle incomeMoldovaMongoliaMontenegroMoroccoMozambiqueMyanmarNamibiaNauruNepalNetherlandsNicaraguaNigerNorwayOECD membersOmanOther small statesPacific island small statesPakistanPalauPanamaPapua New GuineaParaguayPeruPhilippinesPolandPortugalPost-demographic dividendPre-demographic dividendQatarRomaniaRussian FederationRwandaSamoaSan MarinoSao Tome and PrincipeSaudi ArabiaSenegalSerbiaSeychellesSierra LeoneSlovak RepublicSloveniaSmall statesSolomon IslandsSouth AfricaSouth AsiaSouth Asia (IDA & IBRD)South SudanSpainSri LankaSt. Kitts and NevisSt. LuciaSt. Vincent and the GrenadinesSub-Saharan Africa Sub-Saharan Africa (excluding high income)Sub-Saharan Africa (IDA & IBRD countries)SudanSurinameSwazilandSwedenSwitzerlandSyrian Arab RepublicTajikistanTanzaniaThailandTimor-LesteTogoTongaTrinidad and TobagoTunisiaTurkeyTuvaluUgandaUkraineUnited Arab EmiratesUpper middle incomeUruguayUzbekistanVanuatuVenezuela, RBVietnamWest Bank and GazaWorldYemen, Rep.ZambiaZimbabwe La ligne de temps
Cette échelle de temps montre un graphique de 1975 année à 2015 année Middle East & North Africa. Les données jusqu'à 1974 année ne sont pas présentés. Quantité d'observations actuelles selon dates: 41.
Source (désignation):
Les indicateurs du développement mondiale
Source (organisation):
United Nations Educational, Scientific, and Cultural Organization (UNESCO) Institute for Statistics.
Catégories:
Education
Dernière mise à jour
23 avr. 2017
Les indicateurs de changement de valeurs selon les années
Minimum:
38.237
1 janv. 1975
Maximum:
78.064
1 janv. 2013
Pour la date d''observation
Valeur
Changement absolu
Le changement par rapport à la valeur précédente
1 janv. 1975
38.237
+38.237
0.0%
1 janv. 1976
39.691
+1.454
3.8%
1 janv. 1977
40.482
+0.792
1.99%
1 janv. 1978
42.04
+1.557
3.85%
1 janv. 1979
45.246
+3.206
7.63%
1 janv. 1980
46.12
+0.874
1.93%
1 janv. 1981
46.925
+0.804
1.74%
1 janv. 1982
47.331
+0.406
0.87%
1 janv. 1983
47.596
+0.266
0.56%
1 janv. 1984
48.36
+0.764
1.6%
1 janv. 1985
49.804
+1.443
2.98%
1 janv. 1986
51.586
+1.782
3.58%
1 janv. 1987
53.33
+1.744
3.38%
1 janv. 1988
53.656
+0.326
0.61%
1 janv. 1989
56.167
+2.51
4.68%
1 janv. 1990
57.338
+1.171
2.08%
1 janv. 1991
58.176
+0.839
1.46%
1 janv. 1992
57.598
-0.578
-0.99%
1 janv. 1993
59.391
+1.793
3.11%
1 janv. 1994
60.83
+1.439
2.42%
1 janv. 1995
62.506
+1.676
2.76%
1 janv. 1996
63.13
+0.624
1.0%
1 janv. 1997
63.678
+0.548
0.87%
1 janv. 1998
63.436
-0.242
-0.38%
1 janv. 1999
63.957
+0.522
0.82%
1 janv. 2000
64.476
+0.519
0.81%
1 janv. 2001
65.32
+0.844
1.31%
1 janv. 2002
66.486
+1.165
1.78%
1 janv. 2003
68.164
+1.679
2.52%
1 janv. 2004
70.073
+1.909
2.8%
1 janv. 2005
70.475
+0.402
0.57%
1 janv. 2006
71.364
+0.889
1.26%
1 janv. 2007
69.691
-1.672
-2.34%
1 janv. 2008
69.22
-0.471
-0.68%
1 janv. 2009
69.035
-0.186
-0.27%
1 janv. 2010
71.25
+2.215
3.21%
1 janv. 2011
71.631
+0.381
0.54%
1 janv. 2012
73.952
+2.321
3.24%
1 janv. 2013
78.064
+4.112
5.56%
1 janv. 2014
75.928
-2.136
-2.74%
1 janv. 2015
75.504
-0.424
-0.56%
Classement des pays selon les statistiques actuelles par années


Commentaires: