29
/fr/
fr
AIzaSyAYiBZKx7MnpbEhh9jyipgxe19OcubqV5w
April 1, 2024
117121
Cyprus
CYP
true
2
1
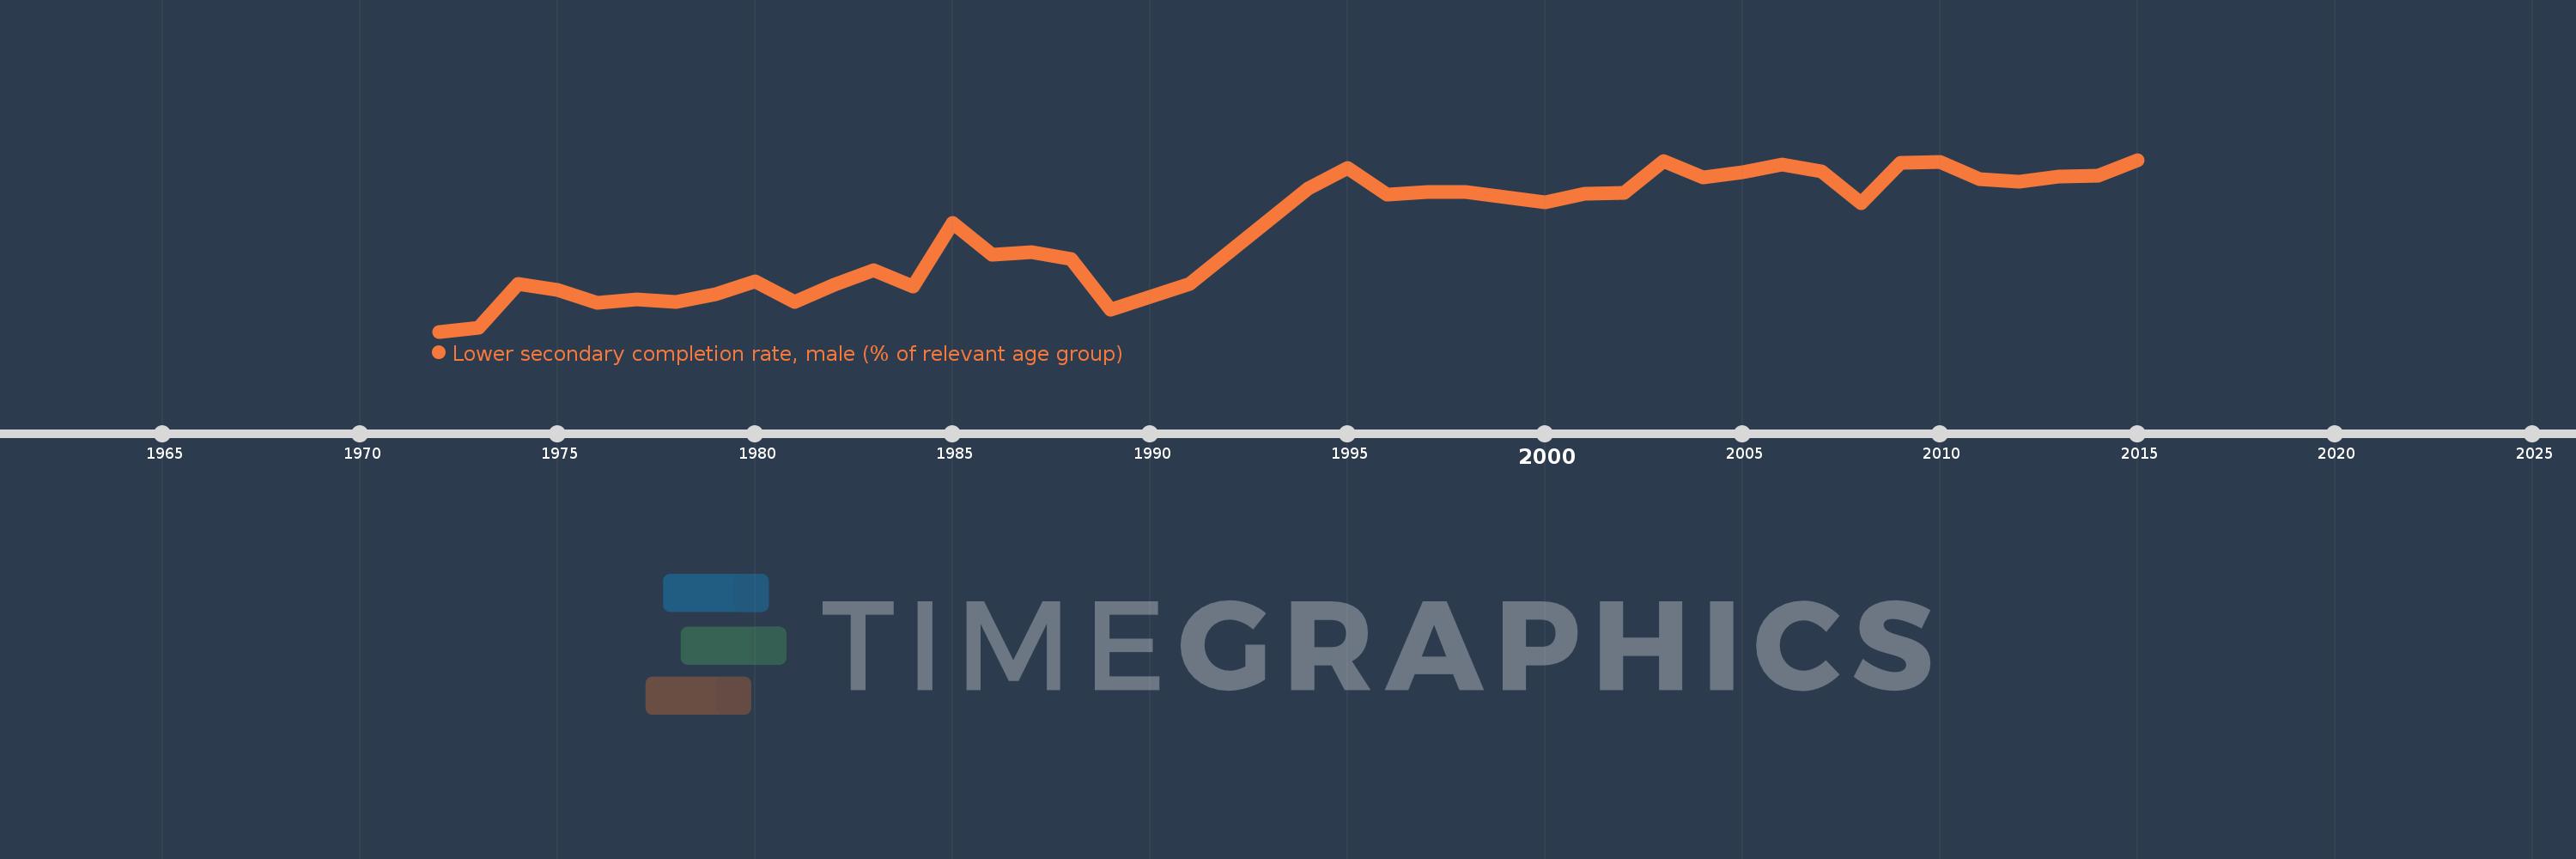
Lower secondary completion rate, male (% of relevant age group)
2015,2014,2013,2012,2011,2010,2009,2008,2007,2006,2005,2004,2003,2002,2001,2000,1998,1997,1996,1995,1994,1991,1989,1988,1987,1986,1985,1984,1983,1982,1981,1980,1979,1978,1977,1976,1975,1974,1973,1972
Cette statistique dans les autres pays:
AfghanistanAlbaniaAlgeriaAngolaAntigua and BarbudaArab WorldArgentinaArmeniaArubaAustriaAzerbaijanBahamas, TheBahrainBangladeshBarbadosBelarusBelgiumBelizeBeninBermudaBhutanBoliviaBosnia and HerzegovinaBotswanaBrunei DarussalamBulgariaBurkina FasoBurundiCabo VerdeCambodiaCameroonCaribbean small statesCentral African RepublicCentral Europe and the BalticsChadChileChinaColombiaComorosCongo, Dem. Rep.Congo, Rep.Costa RicaCote d'IvoireCroatiaCubaCyprusCzech RepublicDenmarkDjiboutiDominicaDominican RepublicEarly-demographic dividendEast Asia & PacificEast Asia & Pacific (excluding high income)East Asia & Pacific (IDA & IBRD countries)EcuadorEgypt, Arab Rep.El SalvadorEquatorial GuineaEritreaEstoniaEthiopiaEuro areaEurope & Central AsiaEurope & Central Asia (excluding high income)Europe & Central Asia (IDA & IBRD countries)European UnionFijiFinlandFragile and conflict affected situationsFranceGabonGambia, TheGeorgiaGermanyGhanaGreeceGrenadaGuatemalaGuineaGuinea-BissauGuyanaHaitiHeavily indebted poor countries (HIPC)High incomeHondurasHong Kong SAR, ChinaHungaryIBRD onlyIcelandIDA & IBRD totalIDA blendIDA onlyIDA totalIndiaIndonesiaIran, Islamic Rep.IraqIrelandIsraelItalyJamaicaJapanJordanKazakhstanKenyaKiribatiKorea, Dem. People’s Rep.Korea, Rep.KuwaitKyrgyz RepublicLao PDRLate-demographic dividendLatin America & Caribbean Latin America & Caribbean (excluding high income)Latin America & the Caribbean (IDA & IBRD countries)LatviaLeast developed countries: UN classificationLebanonLesothoLiberiaLiechtensteinLithuaniaLow & middle incomeLow incomeLower middle incomeLuxembourgMacao SAR, ChinaMacedonia, FYRMadagascarMalawiMaldivesMaliMaltaMarshall IslandsMauritaniaMauritiusMexicoMiddle East & North AfricaMiddle East & North Africa (excluding high income)Middle East & North Africa (IDA & IBRD countries)Middle incomeMoldovaMongoliaMontenegroMoroccoMozambiqueMyanmarNamibiaNauruNepalNetherlandsNicaraguaNigerNorwayOECD membersOmanOther small statesPacific island small statesPakistanPalauPanamaPapua New GuineaParaguayPeruPhilippinesPolandPortugalPost-demographic dividendPre-demographic dividendQatarRomaniaRussian FederationRwandaSamoaSan MarinoSao Tome and PrincipeSaudi ArabiaSenegalSerbiaSeychellesSierra LeoneSlovak RepublicSloveniaSmall statesSolomon IslandsSouth AfricaSouth AsiaSouth Asia (IDA & IBRD)South SudanSpainSri LankaSt. Kitts and NevisSt. LuciaSt. Vincent and the GrenadinesSub-Saharan Africa Sub-Saharan Africa (excluding high income)Sub-Saharan Africa (IDA & IBRD countries)SudanSurinameSwazilandSwedenSwitzerlandSyrian Arab RepublicTajikistanTanzaniaThailandTimor-LesteTogoTongaTrinidad and TobagoTunisiaTurkeyTuvaluUgandaUkraineUnited Arab EmiratesUpper middle incomeUruguayUzbekistanVanuatuVenezuela, RBVietnamWest Bank and GazaWorldYemen, Rep.ZambiaZimbabwe La ligne de temps
Cette échelle de temps montre un graphique de 1972 année à 2015 année Cyprus. Les données jusqu'à 1971 année ne sont pas présentés. Quantité d'observations actuelles selon dates: 40.
Source (désignation):
Les indicateurs du développement mondiale
Source (organisation):
United Nations Educational, Scientific, and Cultural Organization (UNESCO) Institute for Statistics.
Catégories:
Education
Dernière mise à jour
23 avr. 2017
Les indicateurs de changement de valeurs selon les années
Minimum:
43.796
1 janv. 1972
Maximum:
100.449
1 janv. 2015
Pour la date d''observation
Valeur
Changement absolu
Le changement par rapport à la valeur précédente
1 janv. 1972
43.796
+43.796
0.0%
1 janv. 1973
45.079
+1.282
2.93%
1 janv. 1974
59.469
+14.39
31.92%
1 janv. 1975
57.473
-1.995
-3.36%
1 janv. 1976
53.276
-4.197
-7.3%
1 janv. 1977
54.541
+1.265
2.37%
1 janv. 1978
53.62
-0.921
-1.69%
1 janv. 1979
56.149
+2.529
4.72%
1 janv. 1980
60.3
+4.151
7.39%
1 janv. 1981
53.63
-6.67
-11.06%
1 janv. 1982
59.133
+5.503
10.26%
1 janv. 1983
64.037
+4.904
8.29%
1 janv. 1984
58.604
-5.432
-8.48%
1 janv. 1985
79.657
+21.052
35.92%
1 janv. 1986
69.19
-10.466
-13.14%
1 janv. 1987
70.108
+0.918
1.33%
1 janv. 1988
67.722
-2.386
-3.4%
1 janv. 1989
51.117
-16.605
-24.52%
1 janv. 1991
59.425
+8.308
16.25%
1 janv. 1994
90.94
+31.515
53.03%
1 janv. 1995
97.835
+6.895
7.58%
1 janv. 1996
88.845
-8.99
-9.19%
1 janv. 1997
89.765
+0.92
1.04%
1 janv. 1998
89.956
+0.191
0.21%
1 janv. 2000
86.509
-3.447
-3.83%
1 janv. 2001
89.239
+2.729
3.16%
1 janv. 2002
89.501
+0.262
0.29%
1 janv. 2003
99.908
+10.407
11.63%
1 janv. 2004
94.535
-5.374
-5.38%
1 janv. 2005
96.376
+1.842
1.95%
1 janv. 2006
98.98
+2.604
2.7%
1 janv. 2007
96.663
-2.318
-2.34%
1 janv. 2008
86.033
-10.629
-11.0%
1 janv. 2009
99.522
+13.488
15.68%
1 janv. 2010
99.784
+0.262
0.26%
1 janv. 2011
93.983
-5.8
-5.81%
1 janv. 2012
93.164
-0.819
-0.87%
1 janv. 2013
95.056
+1.892
2.03%
1 janv. 2014
95.233
+0.178
0.19%
1 janv. 2015
100.449
+5.216
5.48%
Classement des pays selon les statistiques actuelles par années


Commentaires: