29
/fr/
fr
AIzaSyAYiBZKx7MnpbEhh9jyipgxe19OcubqV5w
April 1, 2024
44445
Least developed countries: UN classification
LDC
false
2
1
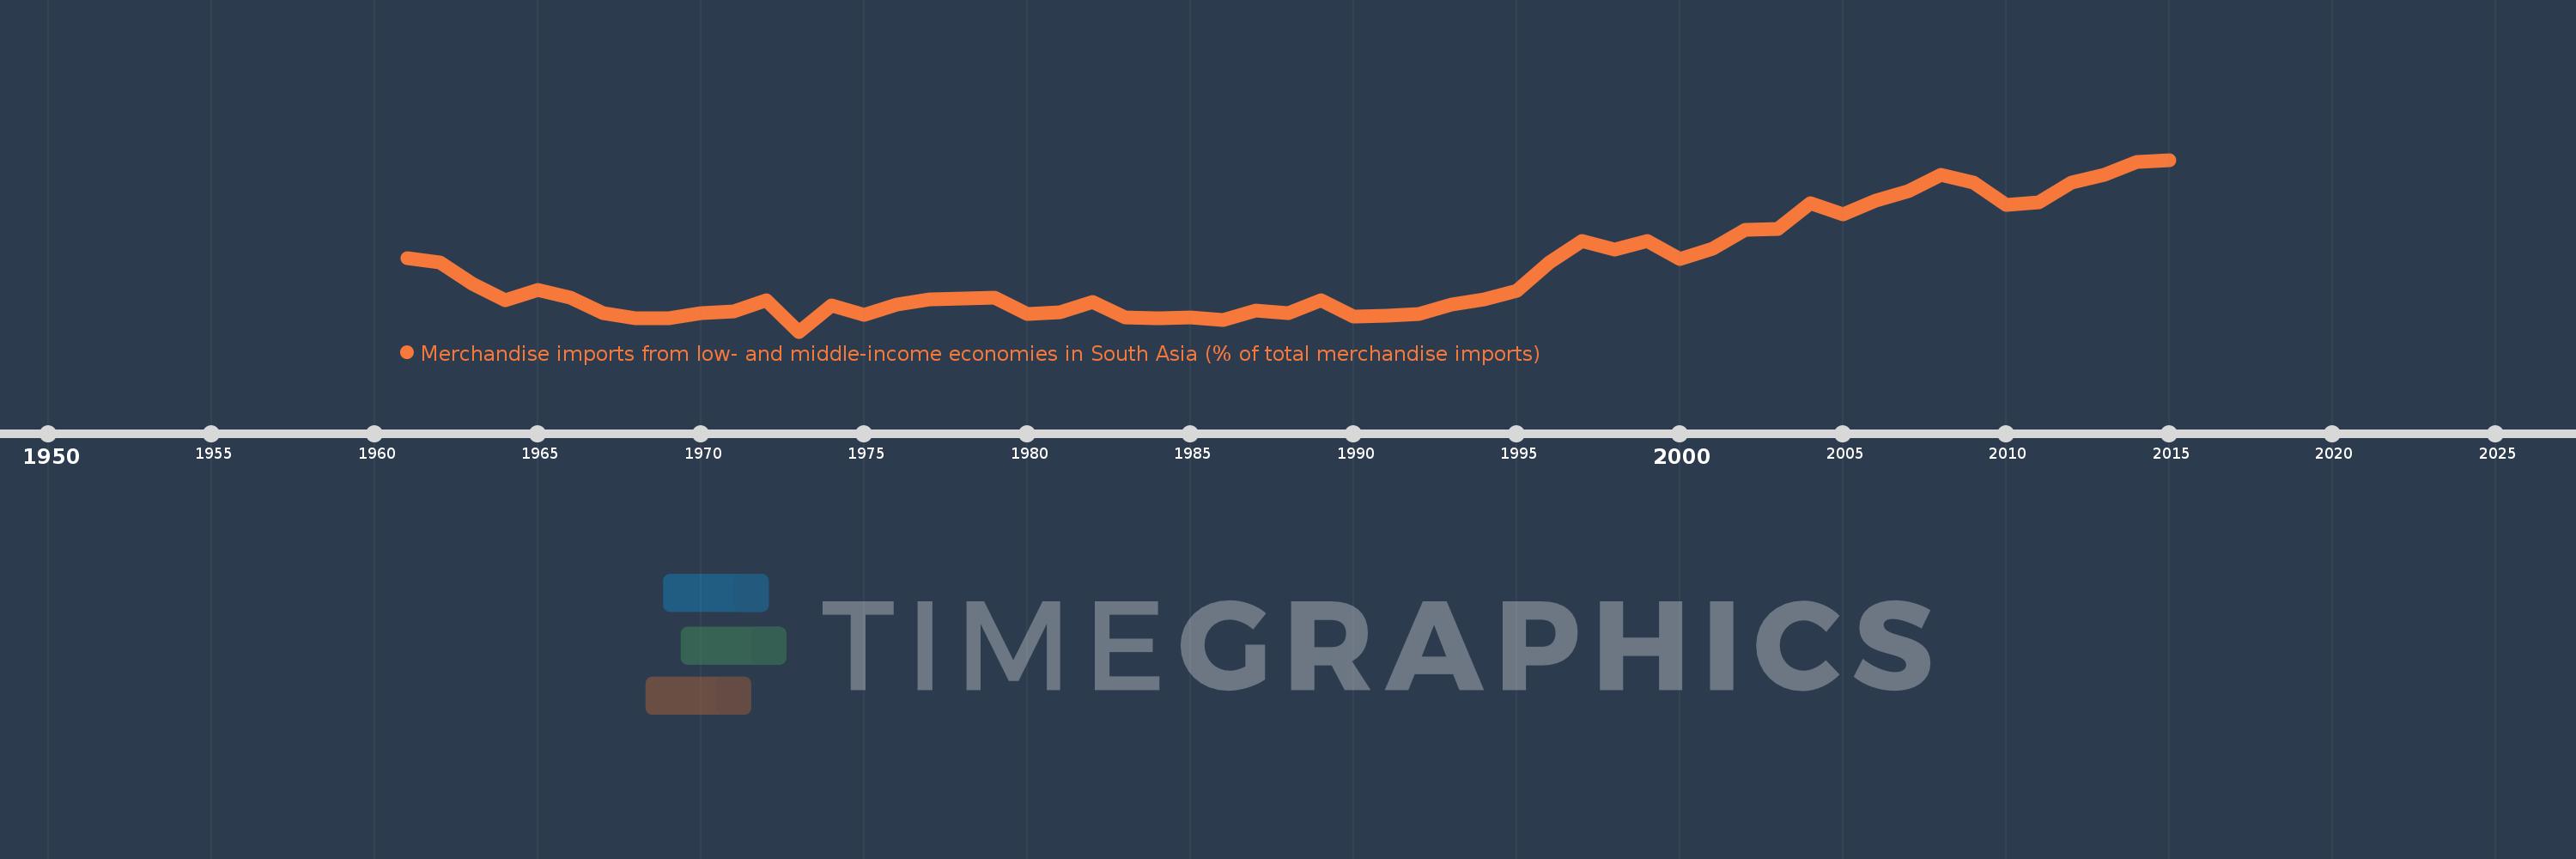
Merchandise imports from low- and middle-income economies in South Asia (% of total merchandise imports)
2015,2014,2013,2012,2011,2010,2009,2008,2007,2006,2005,2004,2003,2002,2001,2000,1999,1998,1997,1996,1995,1994,1993,1992,1991,1990,1989,1988,1987,1986,1985,1984,1983,1982,1981,1980,1979,1978,1977,1976,1975,1974,1973,1972,1971,1970,1969,1968,1967,1966,1965,1964,1963,1962,1961
Cette statistique dans les autres pays:
AfghanistanAlbaniaAlgeriaAngolaAntigua and BarbudaArab WorldArgentinaArmeniaArubaAustraliaAustriaAzerbaijanBahamas, TheBahrainBangladeshBarbadosBelarusBelgiumBelizeBeninBermudaBoliviaBrazilBrunei DarussalamBulgariaBurkina FasoBurundiCabo VerdeCambodiaCameroonCanadaCaribbean small statesCentral African RepublicCentral Europe and the BalticsChadChileChinaColombiaCongo, Dem. Rep.Congo, Rep.Costa RicaCote d'IvoireCroatiaCubaCyprusCzech RepublicDenmarkDjiboutiDominicaDominican RepublicEarly-demographic dividendEast Asia & PacificEast Asia & Pacific (excluding high income)East Asia & Pacific (IDA & IBRD countries)EcuadorEgypt, Arab Rep.El SalvadorEstoniaEthiopiaEuro areaEurope & Central AsiaEurope & Central Asia (excluding high income)Europe & Central Asia (IDA & IBRD countries)European UnionFaroe IslandsFijiFinlandFragile and conflict affected situationsFranceGabonGambia, TheGeorgiaGermanyGhanaGibraltarGreeceGreenlandGrenadaGuatemalaGuineaGuyanaHaitiHeavily indebted poor countries (HIPC)High incomeHondurasHong Kong SAR, ChinaHungaryIBRD onlyIcelandIDA & IBRD totalIDA blendIDA onlyIDA totalIndiaIndonesiaIran, Islamic Rep.IraqIrelandIsraelItalyJamaicaJapanJordanKazakhstanKenyaKiribatiKorea, Dem. People’s Rep.Korea, Rep.KosovoKuwaitKyrgyz RepublicLao PDRLate-demographic dividendLatin America & Caribbean Latin America & Caribbean (excluding high income)Latin America & the Caribbean (IDA & IBRD countries)LatviaLeast developed countries: UN classificationLebanonLiberiaLibyaLithuaniaLow & middle incomeLow incomeLower middle incomeLuxembourgMacao SAR, ChinaMacedonia, FYRMadagascarMalawiMalaysiaMaldivesMaliMaltaMauritaniaMauritiusMexicoMiddle East & North AfricaMiddle East & North Africa (excluding high income)Middle East & North Africa (IDA & IBRD countries)Middle incomeMoldovaMongoliaMontenegroMoroccoMozambiqueMyanmarNauruNepalNetherlandsNew CaledoniaNew ZealandNicaraguaNigerNigeriaNorth AmericaNorwayOECD membersOmanOther small statesPacific island small statesPakistanPanamaPapua New GuineaParaguayPeruPhilippinesPolandPortugalPost-demographic dividendPre-demographic dividendQatarRomaniaRussian FederationRwandaSamoaSaudi ArabiaSenegalSerbiaSeychellesSierra LeoneSingaporeSlovak RepublicSloveniaSmall statesSolomon IslandsSomaliaSouth AfricaSouth AsiaSouth Asia (IDA & IBRD)SpainSri LankaSt. Kitts and NevisSt. LuciaSt. Vincent and the GrenadinesSub-Saharan Africa Sub-Saharan Africa (excluding high income)Sub-Saharan Africa (IDA & IBRD countries)SudanSurinameSwedenSwitzerlandSyrian Arab RepublicTajikistanTanzaniaThailandTogoTongaTrinidad and TobagoTunisiaTurkeyTurkmenistanUgandaUkraineUnited Arab EmiratesUnited KingdomUnited StatesUpper middle incomeUruguayUzbekistanVanuatuVenezuela, RBVietnamWorldYemen, Rep.ZambiaZimbabwe La ligne de temps
Cette échelle de temps montre un graphique de 1961 année à 2015 année Least developed countries: UN classification. Les données jusqu'à 1960 année ne sont pas présentés. Quantité d'observations actuelles selon dates: 55.
Source (désignation):
Les indicateurs du développement mondiale
Source (organisation):
World Bank staff estimates based data from International Monetary Fund's Direction of Trade database.
Catégories:
Private Sector, Trade
Dernière mise à jour
23 avr. 2017
Les indicateurs de changement de valeurs selon les années
Minimum:
1.694
1 janv. 1973
Maximum:
10.12
1 janv. 2015
Pour la date d''observation
Valeur
Changement absolu
Le changement par rapport à la valeur précédente
1 janv. 1961
5.315
+5.315
0.0%
1 janv. 1962
5.106
-0.21
-3.94%
1 janv. 1963
4.029
-1.077
-21.09%
1 janv. 1964
3.245
-0.784
-19.46%
1 janv. 1965
3.746
+0.501
15.43%
1 janv. 1966
3.338
-0.408
-10.88%
1 janv. 1967
2.607
-0.731
-21.91%
1 janv. 1968
2.346
-0.26
-9.99%
1 janv. 1969
2.338
-0.008
-0.35%
1 janv. 1970
2.6
+0.262
11.19%
1 janv. 1971
2.702
+0.102
3.94%
1 janv. 1972
3.223
+0.521
19.27%
1 janv. 1973
1.694
-1.529
-47.44%
1 janv. 1974
2.985
+1.291
76.23%
1 janv. 1975
2.519
-0.466
-15.6%
1 janv. 1976
3.018
+0.498
19.79%
1 janv. 1977
3.281
+0.263
8.73%
1 janv. 1978
3.327
+0.046
1.4%
1 janv. 1979
3.365
+0.039
1.16%
1 janv. 1980
2.537
-0.828
-24.61%
1 janv. 1981
2.641
+0.104
4.1%
1 janv. 1982
3.146
+0.504
19.08%
1 janv. 1983
2.371
-0.774
-24.61%
1 janv. 1984
2.349
-0.022
-0.95%
1 janv. 1985
2.371
+0.022
0.92%
1 janv. 1986
2.27
-0.101
-4.24%
1 janv. 1987
2.735
+0.465
20.5%
1 janv. 1988
2.606
-0.129
-4.73%
1 janv. 1989
3.235
+0.628
24.12%
1 janv. 1990
2.441
-0.794
-24.55%
1 janv. 1991
2.475
+0.035
1.43%
1 janv. 1992
2.563
+0.088
3.56%
1 janv. 1993
3.014
+0.45
17.56%
1 janv. 1994
3.256
+0.243
8.05%
1 janv. 1995
3.686
+0.43
13.21%
1 janv. 1996
5.102
+1.416
38.4%
1 janv. 1997
6.149
+1.047
20.52%
1 janv. 1998
5.724
-0.425
-6.91%
1 janv. 1999
6.118
+0.395
6.89%
1 janv. 2000
5.275
-0.843
-13.77%
1 janv. 2001
5.771
+0.496
9.39%
1 janv. 2002
6.676
+0.906
15.69%
1 janv. 2003
6.743
+0.066
0.99%
1 janv. 2004
8.001
+1.259
18.67%
1 janv. 2005
7.462
-0.54
-6.74%
1 janv. 2006
8.103
+0.641
8.59%
1 janv. 2007
8.577
+0.474
5.85%
1 janv. 2008
9.363
+0.787
9.17%
1 janv. 2009
8.988
-0.375
-4.01%
1 janv. 2010
7.916
-1.072
-11.93%
1 janv. 2011
8.037
+0.121
1.53%
1 janv. 2012
8.987
+0.95
11.82%
1 janv. 2013
9.37
+0.383
4.26%
1 janv. 2014
10.001
+0.631
6.73%
1 janv. 2015
10.12
+0.119
1.19%
Classement des pays selon les statistiques actuelles par années


Commentaires: