29
/fr/
fr
AIzaSyAYiBZKx7MnpbEhh9jyipgxe19OcubqV5w
April 1, 2024
28346
East Asia & Pacific (excluding high income)
EAP
false
2
1
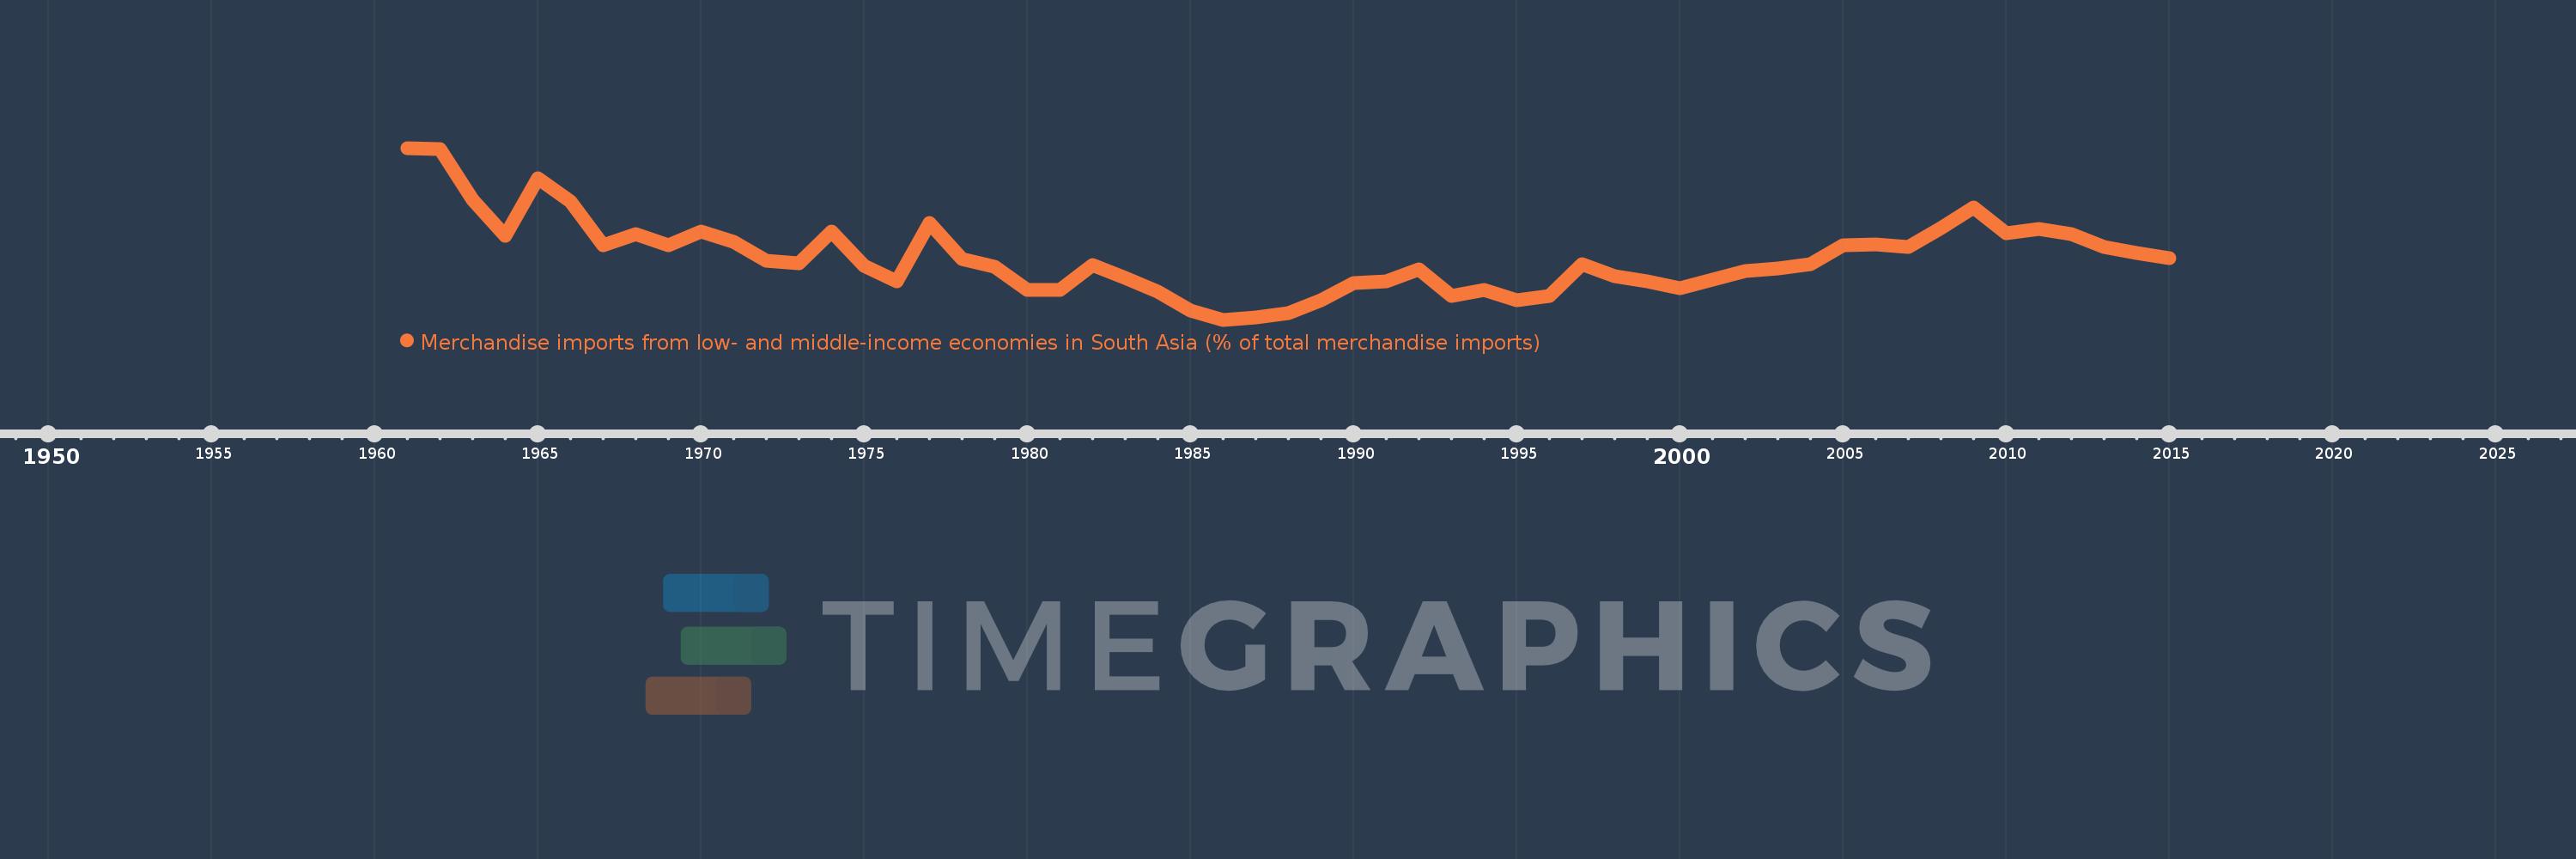
Merchandise imports from low- and middle-income economies in South Asia (% of total merchandise imports)
2015,2014,2013,2012,2011,2010,2009,2008,2007,2006,2005,2004,2003,2002,2001,2000,1999,1998,1997,1996,1995,1994,1993,1992,1991,1990,1989,1988,1987,1986,1985,1984,1983,1982,1981,1980,1979,1978,1977,1976,1975,1974,1973,1972,1971,1970,1969,1968,1967,1966,1965,1964,1963,1962,1961
Cette statistique dans les autres pays:
AfghanistanAlbaniaAlgeriaAngolaAntigua and BarbudaArab WorldArgentinaArmeniaArubaAustraliaAustriaAzerbaijanBahamas, TheBahrainBangladeshBarbadosBelarusBelgiumBelizeBeninBermudaBoliviaBrazilBrunei DarussalamBulgariaBurkina FasoBurundiCabo VerdeCambodiaCameroonCanadaCaribbean small statesCentral African RepublicCentral Europe and the BalticsChadChileChinaColombiaCongo, Dem. Rep.Congo, Rep.Costa RicaCote d'IvoireCroatiaCubaCyprusCzech RepublicDenmarkDjiboutiDominicaDominican RepublicEarly-demographic dividendEast Asia & PacificEast Asia & Pacific (excluding high income)East Asia & Pacific (IDA & IBRD countries)EcuadorEgypt, Arab Rep.El SalvadorEstoniaEthiopiaEuro areaEurope & Central AsiaEurope & Central Asia (excluding high income)Europe & Central Asia (IDA & IBRD countries)European UnionFaroe IslandsFijiFinlandFragile and conflict affected situationsFranceGabonGambia, TheGeorgiaGermanyGhanaGibraltarGreeceGreenlandGrenadaGuatemalaGuineaGuyanaHaitiHeavily indebted poor countries (HIPC)High incomeHondurasHong Kong SAR, ChinaHungaryIBRD onlyIcelandIDA & IBRD totalIDA blendIDA onlyIDA totalIndiaIndonesiaIran, Islamic Rep.IraqIrelandIsraelItalyJamaicaJapanJordanKazakhstanKenyaKiribatiKorea, Dem. People’s Rep.Korea, Rep.KosovoKuwaitKyrgyz RepublicLao PDRLate-demographic dividendLatin America & Caribbean Latin America & Caribbean (excluding high income)Latin America & the Caribbean (IDA & IBRD countries)LatviaLeast developed countries: UN classificationLebanonLiberiaLibyaLithuaniaLow & middle incomeLow incomeLower middle incomeLuxembourgMacao SAR, ChinaMacedonia, FYRMadagascarMalawiMalaysiaMaldivesMaliMaltaMauritaniaMauritiusMexicoMiddle East & North AfricaMiddle East & North Africa (excluding high income)Middle East & North Africa (IDA & IBRD countries)Middle incomeMoldovaMongoliaMontenegroMoroccoMozambiqueMyanmarNauruNepalNetherlandsNew CaledoniaNew ZealandNicaraguaNigerNigeriaNorth AmericaNorwayOECD membersOmanOther small statesPacific island small statesPakistanPanamaPapua New GuineaParaguayPeruPhilippinesPolandPortugalPost-demographic dividendPre-demographic dividendQatarRomaniaRussian FederationRwandaSamoaSaudi ArabiaSenegalSerbiaSeychellesSierra LeoneSingaporeSlovak RepublicSloveniaSmall statesSolomon IslandsSomaliaSouth AfricaSouth AsiaSouth Asia (IDA & IBRD)SpainSri LankaSt. Kitts and NevisSt. LuciaSt. Vincent and the GrenadinesSub-Saharan Africa Sub-Saharan Africa (excluding high income)Sub-Saharan Africa (IDA & IBRD countries)SudanSurinameSwedenSwitzerlandSyrian Arab RepublicTajikistanTanzaniaThailandTogoTongaTrinidad and TobagoTunisiaTurkeyTurkmenistanUgandaUkraineUnited Arab EmiratesUnited KingdomUnited StatesUpper middle incomeUruguayUzbekistanVanuatuVenezuela, RBVietnamWorldYemen, Rep.ZambiaZimbabwe La ligne de temps
Cette échelle de temps montre un graphique de 1961 année à 2015 année East Asia & Pacific (excluding high income). Les données jusqu'à 1960 année ne sont pas présentés. Quantité d'observations actuelles selon dates: 55.
Source (désignation):
Les indicateurs du développement mondiale
Source (organisation):
World Bank staff estimates based data from International Monetary Fund's Direction of Trade database.
Catégories:
Private Sector, Trade
Dernière mise à jour
23 avr. 2017
Les indicateurs de changement de valeurs selon les années
Minimum:
0.514
1 janv. 1986
Pour la date d''observation
Valeur
Changement absolu
Le changement par rapport à la valeur précédente
1 janv. 1961
2.8
+2.8
0.0%
1 janv. 1962
2.78
-0.02
-0.71%
1 janv. 1963
2.113
-0.667
-23.98%
1 janv. 1964
1.635
-0.479
-22.66%
1 janv. 1965
2.394
+0.759
46.46%
1 janv. 1966
2.089
-0.305
-12.72%
1 janv. 1967
1.504
-0.585
-28.0%
1 janv. 1968
1.65
+0.146
9.71%
1 janv. 1969
1.509
-0.141
-8.55%
1 janv. 1970
1.685
+0.176
11.65%
1 janv. 1971
1.545
-0.14
-8.3%
1 janv. 1972
1.296
-0.249
-16.14%
1 janv. 1973
1.266
-0.03
-2.28%
1 janv. 1974
1.688
+0.421
33.26%
1 janv. 1975
1.232
-0.456
-26.99%
1 janv. 1976
1.03
-0.202
-16.39%
1 janv. 1977
1.803
+0.773
75.0%
1 janv. 1978
1.318
-0.485
-26.91%
1 janv. 1979
1.219
-0.099
-7.48%
1 janv. 1980
0.916
-0.303
-24.85%
1 janv. 1981
0.911
-0.005
-0.54%
1 janv. 1982
1.241
+0.33
36.18%
1 janv. 1983
1.066
-0.175
-14.12%
1 janv. 1984
0.887
-0.179
-16.78%
1 janv. 1985
0.639
-0.248
-27.97%
1 janv. 1986
0.514
-0.125
-19.57%
1 janv. 1987
0.547
+0.033
6.39%
1 janv. 1988
0.597
+0.05
9.22%
1 janv. 1989
0.776
+0.179
29.97%
1 janv. 1990
1.004
+0.228
29.39%
1 janv. 1991
1.02
+0.016
1.54%
1 janv. 1992
1.185
+0.166
16.24%
1 janv. 1993
0.829
-0.356
-30.03%
1 janv. 1994
0.911
+0.082
9.83%
1 janv. 1995
0.779
-0.132
-14.49%
1 janv. 1996
0.829
+0.05
6.41%
1 janv. 1997
1.253
+0.425
51.23%
1 janv. 1998
1.093
-0.16
-12.8%
1 janv. 1999
1.021
-0.072
-6.55%
1 janv. 2000
0.928
-0.093
-9.1%
1 janv. 2001
1.046
+0.117
12.63%
1 janv. 2002
1.164
+0.119
11.38%
1 janv. 2003
1.192
+0.028
2.4%
1 janv. 2004
1.259
+0.067
5.62%
1 janv. 2005
1.501
+0.241
19.16%
1 janv. 2006
1.512
+0.012
0.78%
1 janv. 2007
1.486
-0.026
-1.74%
1 janv. 2008
1.729
+0.243
16.34%
1 janv. 2009
2.012
+0.283
16.34%
1 janv. 2010
1.67
-0.341
-16.97%
1 janv. 2011
1.721
+0.051
3.05%
1 janv. 2012
1.657
-0.064
-3.7%
1 janv. 2013
1.478
-0.18
-10.84%
1 janv. 2014
1.403
-0.074
-5.03%
1 janv. 2015
1.334
-0.069
-4.91%
Classement des pays selon les statistiques actuelles par années


Commentaires: