29
/fr/
fr
AIzaSyAYiBZKx7MnpbEhh9jyipgxe19OcubqV5w
April 1, 2024
44176
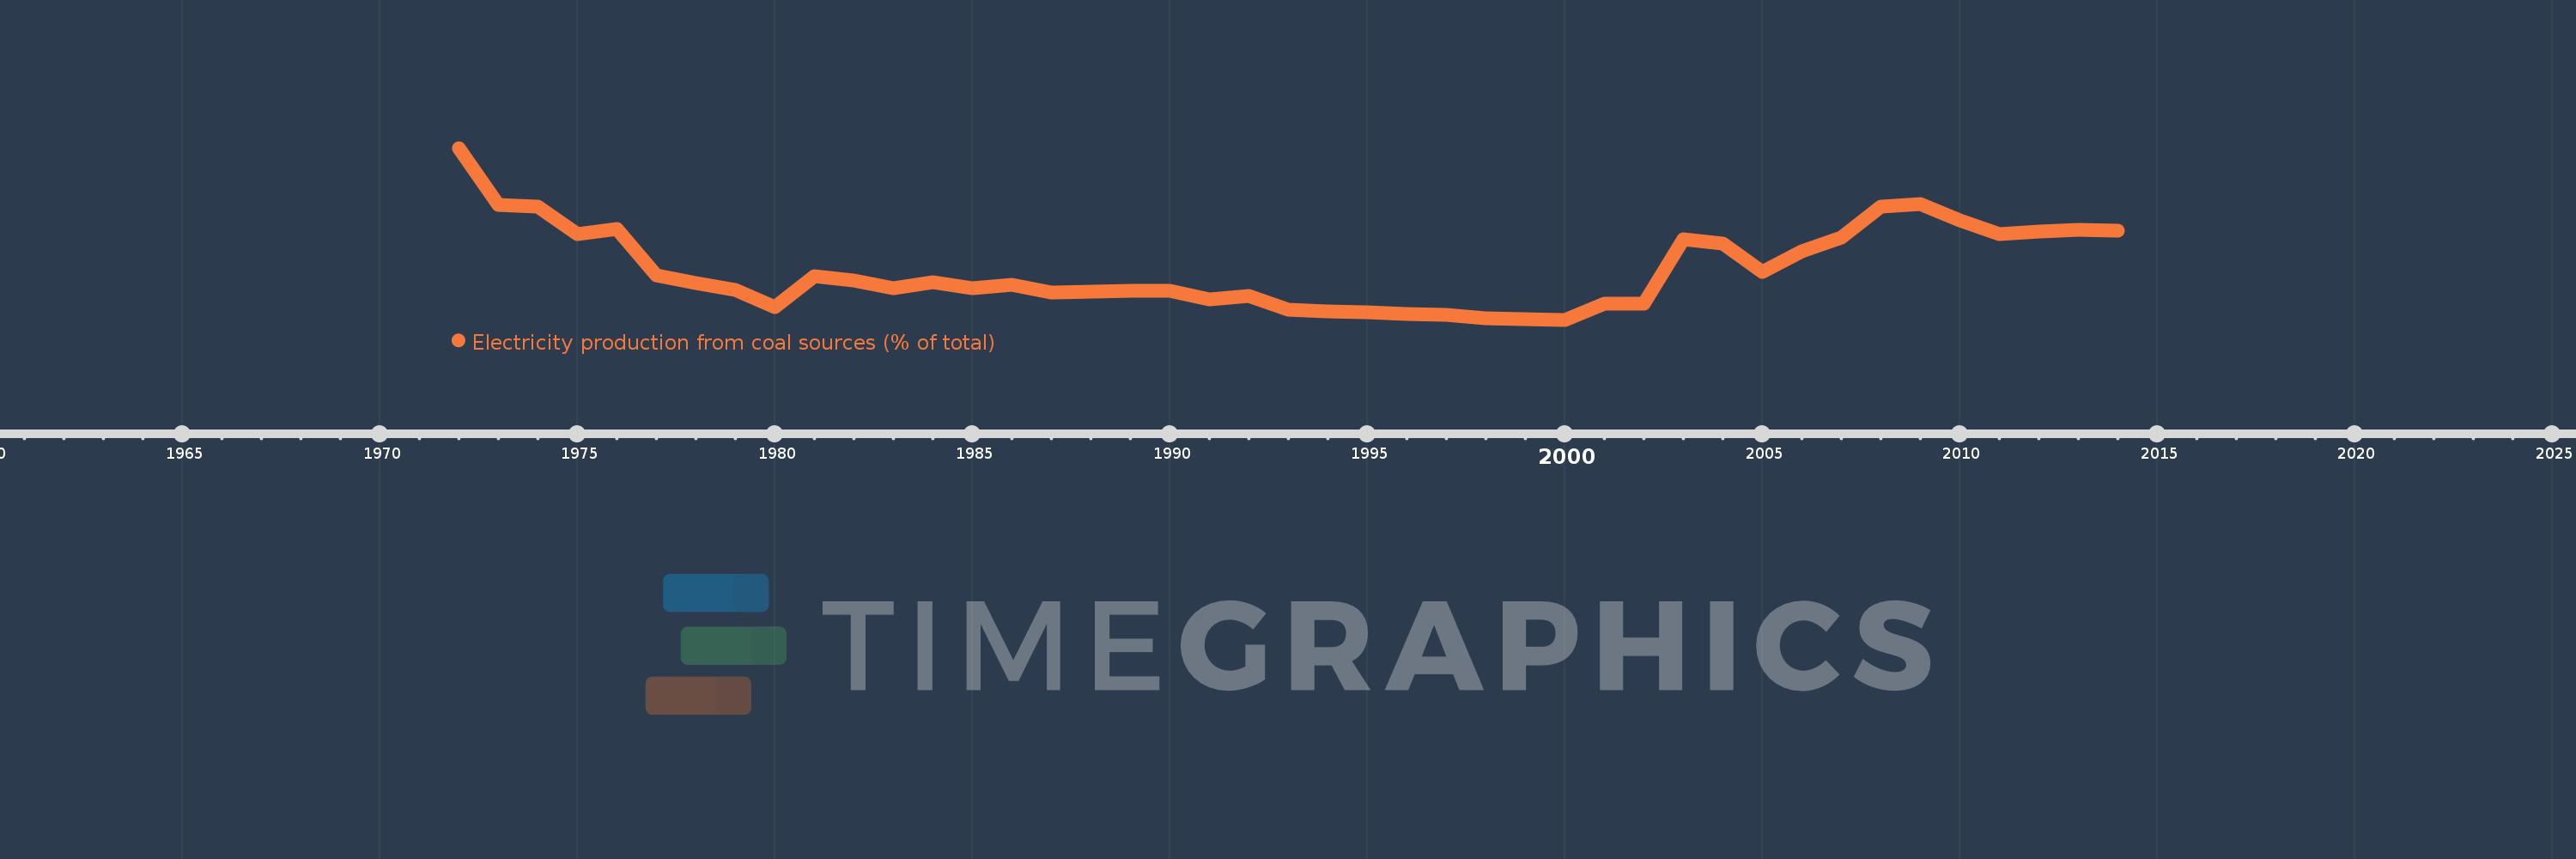
Least developed countries: UN classification
LDC
false
2
1
Electricity production from coal sources (% of total)
2014,2013,2012,2011,2010,2009,2008,2007,2006,2005,2004,2003,2002,2001,2000,1999,1998,1997,1996,1995,1994,1993,1992,1991,1990,1989,1988,1987,1986,1985,1984,1983,1982,1981,1980,1979,1978,1977,1976,1975,1974,1973,1972
Cette statistique dans les autres pays:
AlbaniaAlgeriaAngolaArab WorldArgentinaArmeniaAustraliaAustriaAzerbaijanBahrainBangladeshBelarusBelgiumBeninBoliviaBosnia and HerzegovinaBotswanaBrazilBrunei DarussalamBulgariaCambodiaCameroonCanadaCentral Europe and the BalticsChileChinaColombiaCongo, Dem. Rep.Congo, Rep.Costa RicaCote d'IvoireCroatiaCubaCuracaoCyprusCzech RepublicDenmarkDominican RepublicEarly-demographic dividendEast Asia & PacificEast Asia & Pacific (excluding high income)East Asia & Pacific (IDA & IBRD countries)EcuadorEgypt, Arab Rep.El SalvadorEritreaEstoniaEthiopiaEuro areaEurope & Central AsiaEurope & Central Asia (excluding high income)Europe & Central Asia (IDA & IBRD countries)European UnionFinlandFragile and conflict affected situationsFranceGabonGeorgiaGermanyGhanaGibraltarGreeceGuatemalaHaitiHeavily indebted poor countries (HIPC)High incomeHondurasHong Kong SAR, ChinaHungaryIBRD onlyIcelandIDA & IBRD totalIDA blendIDA onlyIDA totalIndiaIndonesiaIran, Islamic Rep.IraqIrelandIsraelItalyJamaicaJapanJordanKazakhstanKenyaKorea, Dem. People’s Rep.Korea, Rep.KosovoKuwaitKyrgyz RepublicLate-demographic dividendLatin America & Caribbean Latin America & Caribbean (excluding high income)Latin America & the Caribbean (IDA & IBRD countries)LatviaLeast developed countries: UN classificationLebanonLibyaLithuaniaLow & middle incomeLower middle incomeLuxembourgMacedonia, FYRMalaysiaMaltaMauritiusMexicoMiddle East & North AfricaMiddle East & North Africa (excluding high income)Middle East & North Africa (IDA & IBRD countries)Middle incomeMoldovaMongoliaMontenegroMoroccoMozambiqueMyanmarNamibiaNepalNetherlandsNew ZealandNicaraguaNigerNigeriaNorth AmericaNorwayOECD membersOmanOther small statesPakistanPanamaParaguayPeruPhilippinesPolandPortugalPost-demographic dividendPre-demographic dividendQatarRomaniaRussian FederationSaudi ArabiaSenegalSerbiaSingaporeSlovak RepublicSloveniaSmall statesSouth AfricaSouth AsiaSouth Asia (IDA & IBRD)South SudanSpainSri LankaSub-Saharan Africa Sub-Saharan Africa (excluding high income)Sub-Saharan Africa (IDA & IBRD countries)SudanSwedenSwitzerlandSyrian Arab RepublicTajikistanTanzaniaThailandTogoTrinidad and TobagoTunisiaTurkeyTurkmenistanUkraineUnited Arab EmiratesUnited KingdomUnited StatesUpper middle incomeUruguayUzbekistanVenezuela, RBVietnamWorldYemen, Rep.ZambiaZimbabwe La ligne de temps
Cette échelle de temps montre un graphique de 1972 année à 2014 année Least developed countries: UN classification. Les données jusqu'à 1971 année ne sont pas présentés. Quantité d'observations actuelles selon dates: 43.
Source (désignation):
Les indicateurs du développement mondiale
Source (organisation):
IEA Statistics © OECD/IEA 2014 (http://www.iea.org/stats/index.asp), subject to https://www.iea.org/t&c/termsandconditions/
Catégories:
Energy & Mining, Climate Change, Infrastructure
Dernière mise à jour
23 avr. 2017
Les indicateurs de changement de valeurs selon les années
Maximum:
2.069
1 janv. 1972
Pour la date d''observation
Valeur
Changement absolu
Le changement par rapport à la valeur précédente
1 janv. 1972
2.069
+2.069
0.0%
1 janv. 1973
1.416
-0.653
-31.56%
1 janv. 1974
1.401
-0.014
-1.02%
1 janv. 1975
1.077
-0.325
-23.16%
1 janv. 1976
1.141
+0.065
6.0%
1 janv. 1977
0.607
-0.534
-46.79%
1 janv. 1978
0.524
-0.083
-13.71%
1 janv. 1979
0.44
-0.084
-16.02%
1 janv. 1980
0.246
-0.194
-44.11%
1 janv. 1981
0.596
+0.35
142.15%
1 janv. 1982
0.552
-0.044
-7.37%
1 janv. 1983
0.464
-0.087
-15.82%
1 janv. 1984
0.526
+0.061
13.23%
1 janv. 1985
0.459
-0.067
-12.72%
1 janv. 1986
0.502
+0.043
9.35%
1 janv. 1987
0.414
-0.088
-17.61%
1 janv. 1988
0.423
+0.009
2.24%
1 janv. 1989
0.434
+0.011
2.6%
1 janv. 1990
0.434
+0.0
0.03%
1 janv. 1991
0.33
-0.104
-23.97%
1 janv. 1992
0.373
+0.043
12.93%
1 janv. 1993
0.211
-0.161
-43.32%
1 janv. 1994
0.196
-0.015
-7.22%
1 janv. 1995
0.183
-0.013
-6.42%
1 janv. 1996
0.166
-0.018
-9.69%
1 janv. 1997
0.158
-0.008
-4.6%
1 janv. 1998
0.118
-0.04
-25.57%
1 janv. 1999
0.11
-0.008
-6.53%
1 janv. 2000
0.1
-0.01
-8.65%
1 janv. 2001
0.282
+0.181
180.65%
1 janv. 2002
0.286
+0.005
1.65%
1 janv. 2003
1.022
+0.736
256.86%
1 janv. 2004
0.97
-0.052
-5.05%
1 janv. 2005
0.65
-0.321
-33.05%
1 janv. 2006
0.88
+0.231
35.49%
1 janv. 2007
1.044
+0.163
18.53%
1 janv. 2008
1.399
+0.355
34.06%
1 janv. 2009
1.431
+0.032
2.28%
1 janv. 2010
1.238
-0.193
-13.5%
1 janv. 2011
1.082
-0.156
-12.6%
1 janv. 2012
1.111
+0.029
2.7%
1 janv. 2013
1.128
+0.017
1.52%
1 janv. 2014
1.119
-0.008
-0.75%
Classement des pays selon les statistiques actuelles par années


Commentaires: