29
/fr/
fr
AIzaSyAYiBZKx7MnpbEhh9jyipgxe19OcubqV5w
April 1, 2024
163655
Japan
JPN
true
2
1
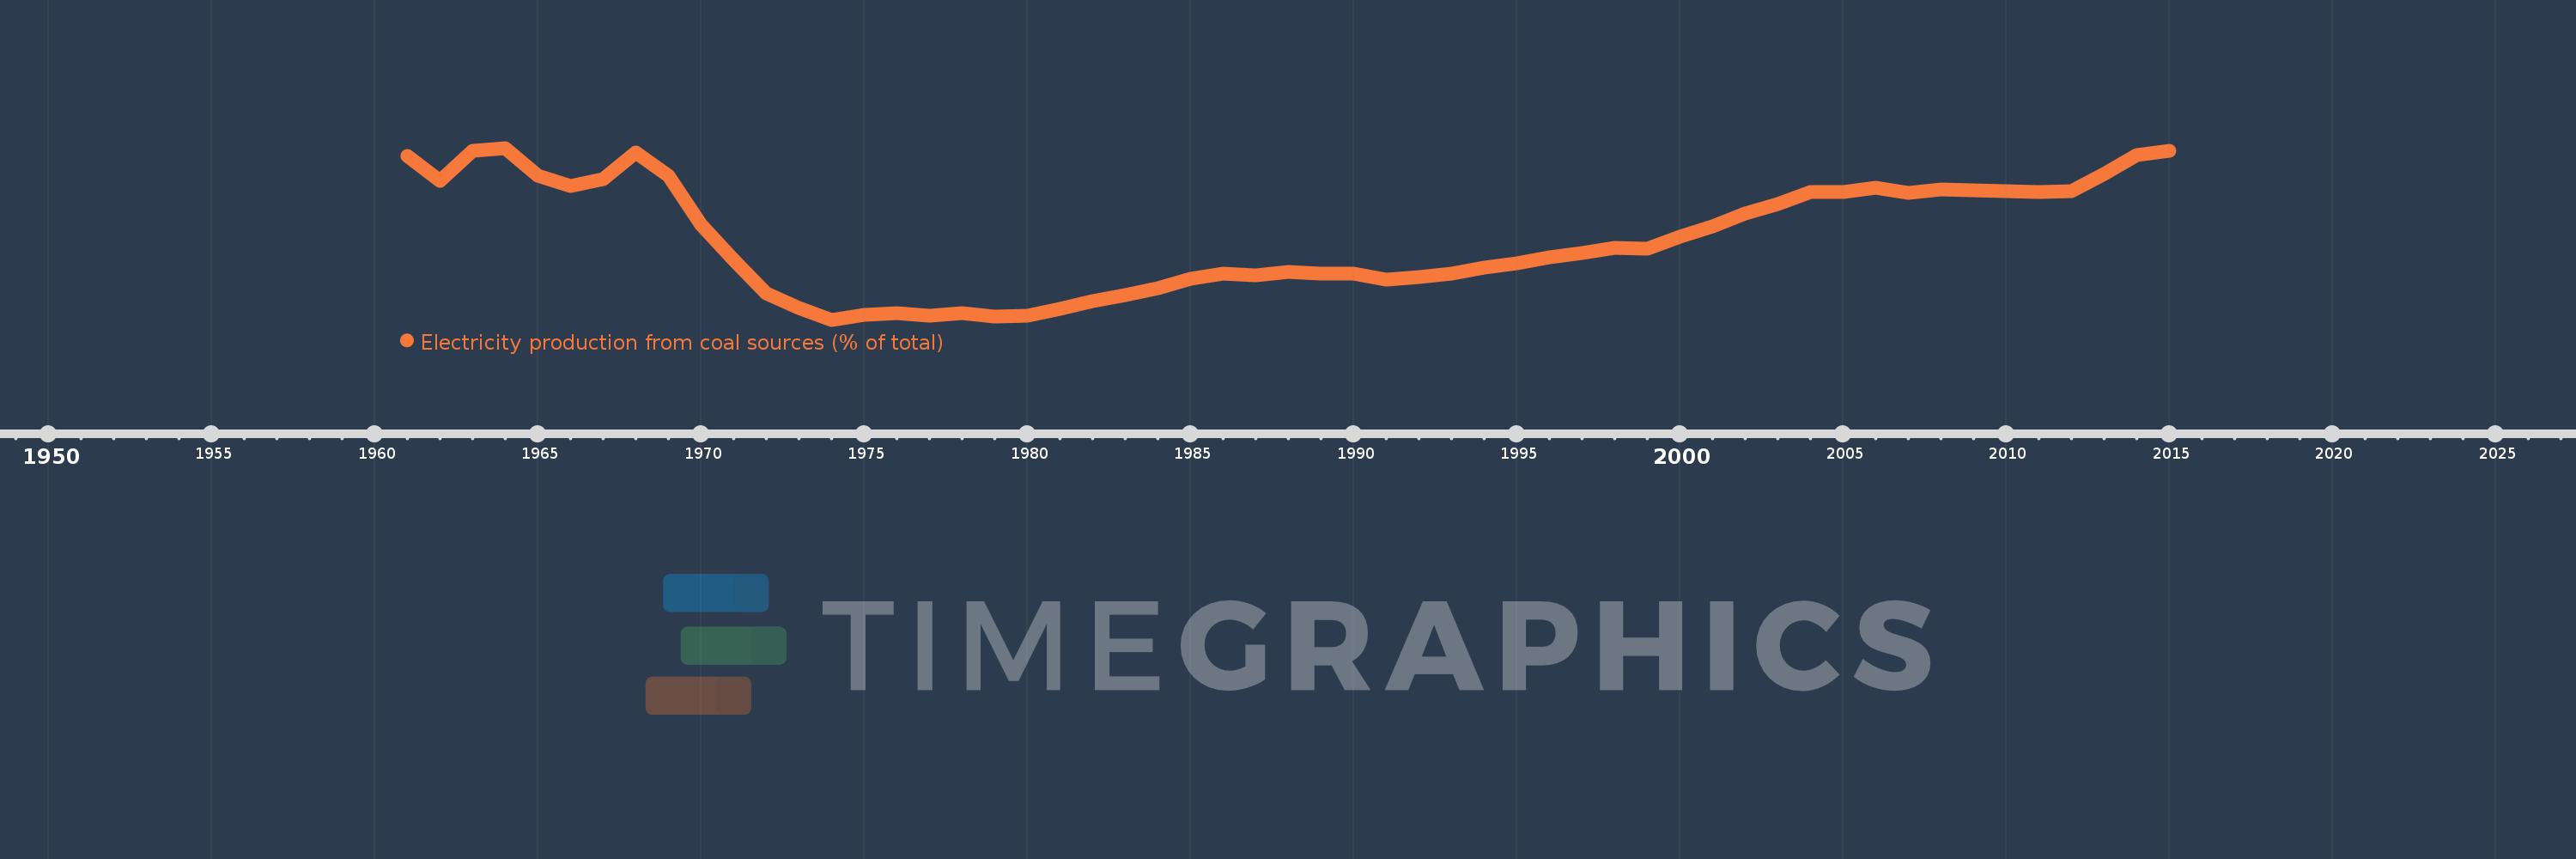
Electricity production from coal sources (% of total)
2015,2014,2013,2012,2011,2010,2009,2008,2007,2006,2005,2004,2003,2002,2001,2000,1999,1998,1997,1996,1995,1994,1993,1992,1991,1990,1989,1988,1987,1986,1985,1984,1983,1982,1981,1980,1979,1978,1977,1976,1975,1974,1973,1972,1971,1970,1969,1968,1967,1966,1965,1964,1963,1962,1961
Cette statistique dans les autres pays:
AlbaniaAlgeriaAngolaArab WorldArgentinaArmeniaAustraliaAustriaAzerbaijanBahrainBangladeshBelarusBelgiumBeninBoliviaBosnia and HerzegovinaBotswanaBrazilBrunei DarussalamBulgariaCambodiaCameroonCanadaCentral Europe and the BalticsChileChinaColombiaCongo, Dem. Rep.Congo, Rep.Costa RicaCote d'IvoireCroatiaCubaCuracaoCyprusCzech RepublicDenmarkDominican RepublicEarly-demographic dividendEast Asia & PacificEast Asia & Pacific (excluding high income)East Asia & Pacific (IDA & IBRD countries)EcuadorEgypt, Arab Rep.El SalvadorEritreaEstoniaEthiopiaEuro areaEurope & Central AsiaEurope & Central Asia (excluding high income)Europe & Central Asia (IDA & IBRD countries)European UnionFinlandFragile and conflict affected situationsFranceGabonGeorgiaGermanyGhanaGibraltarGreeceGuatemalaHaitiHeavily indebted poor countries (HIPC)High incomeHondurasHong Kong SAR, ChinaHungaryIBRD onlyIcelandIDA & IBRD totalIDA blendIDA onlyIDA totalIndiaIndonesiaIran, Islamic Rep.IraqIrelandIsraelItalyJamaicaJapanJordanKazakhstanKenyaKorea, Dem. People’s Rep.Korea, Rep.KosovoKuwaitKyrgyz RepublicLate-demographic dividendLatin America & Caribbean Latin America & Caribbean (excluding high income)Latin America & the Caribbean (IDA & IBRD countries)LatviaLeast developed countries: UN classificationLebanonLibyaLithuaniaLow & middle incomeLower middle incomeLuxembourgMacedonia, FYRMalaysiaMaltaMauritiusMexicoMiddle East & North AfricaMiddle East & North Africa (excluding high income)Middle East & North Africa (IDA & IBRD countries)Middle incomeMoldovaMongoliaMontenegroMoroccoMozambiqueMyanmarNamibiaNepalNetherlandsNew ZealandNicaraguaNigerNigeriaNorth AmericaNorwayOECD membersOmanOther small statesPakistanPanamaParaguayPeruPhilippinesPolandPortugalPost-demographic dividendPre-demographic dividendQatarRomaniaRussian FederationSaudi ArabiaSenegalSerbiaSingaporeSlovak RepublicSloveniaSmall statesSouth AfricaSouth AsiaSouth Asia (IDA & IBRD)South SudanSpainSri LankaSub-Saharan Africa Sub-Saharan Africa (excluding high income)Sub-Saharan Africa (IDA & IBRD countries)SudanSwedenSwitzerlandSyrian Arab RepublicTajikistanTanzaniaThailandTogoTrinidad and TobagoTunisiaTurkeyTurkmenistanUkraineUnited Arab EmiratesUnited KingdomUnited StatesUpper middle incomeUruguayUzbekistanVenezuela, RBVietnamWorldYemen, Rep.ZambiaZimbabwe La ligne de temps
Cette échelle de temps montre un graphique de 1961 année à 2015 année Japan. Les données jusqu'à 1960 année ne sont pas présentés. Quantité d'observations actuelles selon dates: 55.
Source (désignation):
Les indicateurs du développement mondiale
Source (organisation):
IEA Statistics © OECD/IEA 2014 (http://www.iea.org/stats/index.asp), subject to https://www.iea.org/t&c/termsandconditions/
Catégories:
Energy & Mining, Climate Change, Infrastructure
Dernière mise à jour
23 avr. 2017
Les indicateurs de changement de valeurs selon les années
Minimum:
8.015
1 janv. 1974
Maximum:
33.444
1 janv. 1964
Pour la date d''observation
Valeur
Changement absolu
Le changement par rapport à la valeur précédente
1 janv. 1961
32.208
+32.208
0.0%
1 janv. 1962
28.539
-3.669
-11.39%
1 janv. 1963
33.048
+4.509
15.8%
1 janv. 1964
33.444
+0.395
1.2%
1 janv. 1965
29.325
-4.119
-12.32%
1 janv. 1966
27.846
-1.479
-5.04%
1 janv. 1967
28.857
+1.011
3.63%
1 janv. 1968
32.821
+3.963
13.73%
1 janv. 1969
29.38
-3.44
-10.48%
1 janv. 1970
22.031
-7.349
-25.01%
1 janv. 1971
16.939
-5.092
-23.11%
1 janv. 1972
11.857
-5.082
-30.0%
1 janv. 1973
9.772
-2.085
-17.58%
1 janv. 1974
8.015
-1.757
-17.98%
1 janv. 1975
8.701
+0.686
8.56%
1 janv. 1976
8.944
+0.243
2.79%
1 janv. 1977
8.633
-0.31
-3.47%
1 janv. 1978
8.931
+0.298
3.45%
1 janv. 1979
8.498
-0.433
-4.85%
1 janv. 1980
8.601
+0.103
1.21%
1 janv. 1981
9.595
+0.994
11.56%
1 janv. 1982
10.82
+1.225
12.77%
1 janv. 1983
11.626
+0.806
7.45%
1 janv. 1984
12.711
+1.085
9.33%
1 janv. 1985
14.089
+1.378
10.84%
1 janv. 1986
14.894
+0.805
5.72%
1 janv. 1987
14.613
-0.281
-1.89%
1 janv. 1988
15.082
+0.469
3.21%
1 janv. 1989
14.844
-0.238
-1.58%
1 janv. 1990
14.812
-0.033
-0.22%
1 janv. 1991
13.925
-0.887
-5.99%
1 janv. 1992
14.303
+0.378
2.71%
1 janv. 1993
14.888
+0.585
4.09%
1 janv. 1994
15.743
+0.856
5.75%
1 janv. 1995
16.33
+0.587
3.73%
1 janv. 1996
17.243
+0.912
5.59%
1 janv. 1997
17.839
+0.597
3.46%
1 janv. 1998
18.628
+0.789
4.42%
1 janv. 1999
18.578
-0.05
-0.27%
1 janv. 2000
20.291
+1.713
9.22%
1 janv. 2001
21.829
+1.538
7.58%
1 janv. 2002
23.771
+1.942
8.9%
1 janv. 2003
25.106
+1.335
5.61%
1 janv. 2004
26.881
+1.776
7.07%
1 janv. 2005
26.889
+0.008
0.03%
1 janv. 2006
27.601
+0.712
2.65%
1 janv. 2007
26.741
-0.86
-3.12%
1 janv. 2008
27.357
+0.616
2.3%
1 janv. 2009
27.162
-0.195
-0.71%
1 janv. 2010
27.002
-0.16
-0.59%
1 janv. 2011
26.982
-0.02
-0.07%
1 janv. 2012
27.039
+0.057
0.21%
1 janv. 2013
29.608
+2.569
9.5%
1 janv. 2014
32.426
+2.818
9.52%
1 janv. 2015
33.078
+0.652
2.01%
Classement des pays selon les statistiques actuelles par années


Commentaires: