29
/fr/
fr
AIzaSyAYiBZKx7MnpbEhh9jyipgxe19OcubqV5w
April 1, 2024
44173
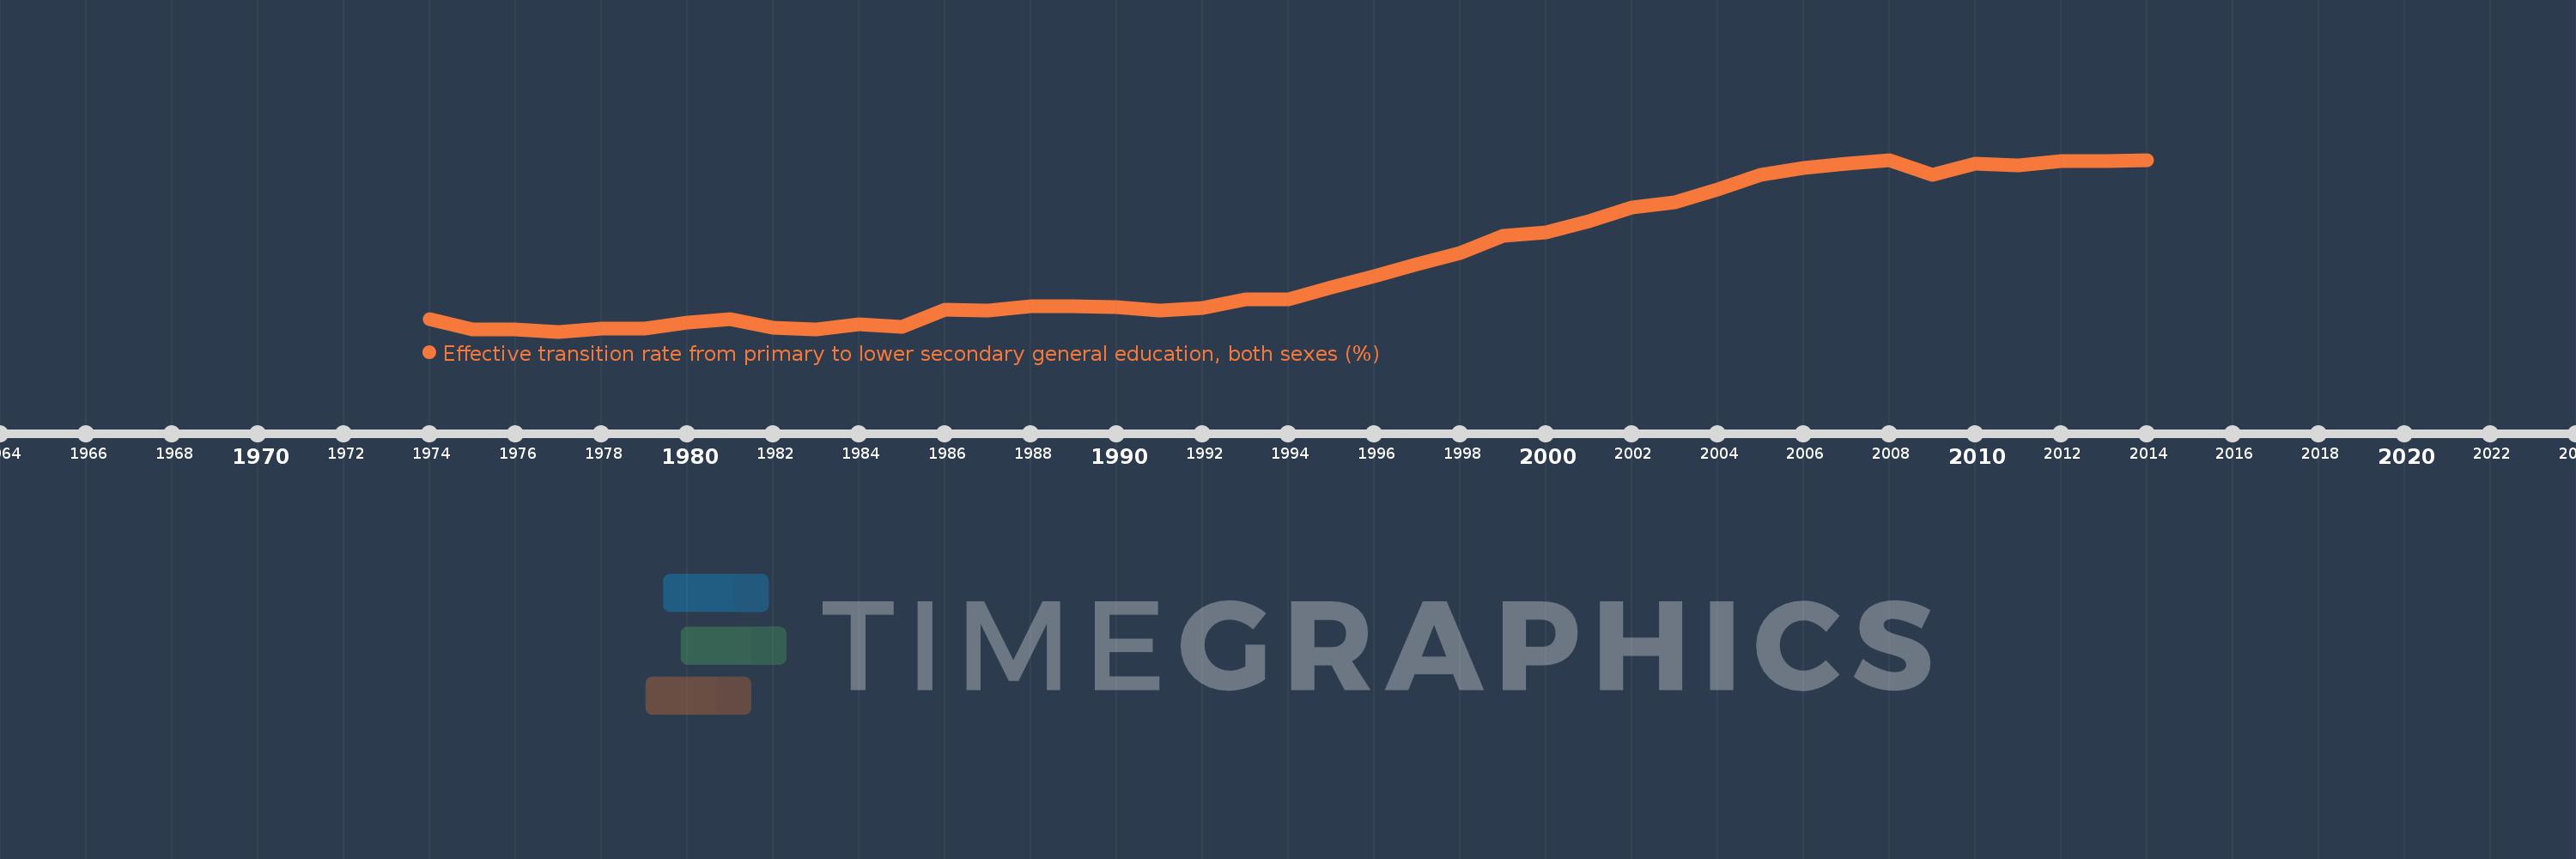
Least developed countries: UN classification
LDC
false
2
1
Effective transition rate from primary to lower secondary general education, both sexes (%)
2014,2013,2012,2011,2010,2009,2008,2007,2006,2005,2004,2003,2002,2001,2000,1999,1998,1997,1996,1995,1994,1993,1992,1991,1990,1989,1988,1987,1986,1985,1984,1983,1982,1981,1980,1979,1978,1977,1976,1975,1974
Cette statistique dans les autres pays:
AfghanistanAlbaniaAlgeriaAngolaAntigua and BarbudaArab WorldArgentinaArmeniaArubaAustriaAzerbaijanBahamas, TheBahrainBangladeshBarbadosBelarusBelgiumBelizeBeninBermudaBhutanBoliviaBosnia and HerzegovinaBotswanaBrazilBritish Virgin IslandsBrunei DarussalamBulgariaBurkina FasoBurundiCabo VerdeCambodiaCameroonCaribbean small statesCayman IslandsCentral African RepublicCentral Europe and the BalticsChadChileChinaColombiaComorosCongo, Dem. Rep.Congo, Rep.Costa RicaCote d'IvoireCroatiaCubaCyprusCzech RepublicDenmarkDjiboutiDominicaDominican RepublicEarly-demographic dividendEast Asia & PacificEast Asia & Pacific (excluding high income)East Asia & Pacific (IDA & IBRD countries)EcuadorEgypt, Arab Rep.El SalvadorEquatorial GuineaEritreaEstoniaEthiopiaEuro areaEurope & Central AsiaEurope & Central Asia (excluding high income)Europe & Central Asia (IDA & IBRD countries)European UnionFijiFinlandFragile and conflict affected situationsFranceGabonGambia, TheGeorgiaGermanyGhanaGreeceGrenadaGuatemalaGuineaGuinea-BissauGuyanaHaitiHeavily indebted poor countries (HIPC)High incomeHondurasHong Kong SAR, ChinaHungaryIBRD onlyIcelandIDA & IBRD totalIDA blendIDA onlyIDA totalIndiaIndonesiaIran, Islamic Rep.IraqIsraelItalyJamaicaJapanJordanKazakhstanKenyaKiribatiKorea, Rep.KuwaitKyrgyz RepublicLao PDRLate-demographic dividendLatin America & Caribbean Latin America & Caribbean (excluding high income)Latin America & the Caribbean (IDA & IBRD countries)LatviaLeast developed countries: UN classificationLebanonLesothoLiberiaLibyaLiechtensteinLithuaniaLow & middle incomeLow incomeLower middle incomeLuxembourgMacao SAR, ChinaMacedonia, FYRMadagascarMalawiMalaysiaMaldivesMaliMaltaMarshall IslandsMauritaniaMauritiusMexicoMiddle East & North AfricaMiddle East & North Africa (excluding high income)Middle East & North Africa (IDA & IBRD countries)Middle incomeMoldovaMonacoMongoliaMoroccoMozambiqueMyanmarNamibiaNepalNetherlandsNicaraguaNigerNorwayOECD membersOmanOther small statesPacific island small statesPakistanPalauPanamaParaguayPeruPhilippinesPolandPortugalPost-demographic dividendPre-demographic dividendQatarRomaniaRussian FederationRwandaSamoaSan MarinoSao Tome and PrincipeSaudi ArabiaSenegalSerbiaSeychellesSierra LeoneSingaporeSlovak RepublicSloveniaSmall statesSolomon IslandsSouth AfricaSouth AsiaSouth Asia (IDA & IBRD)SpainSri LankaSt. Kitts and NevisSt. LuciaSt. Vincent and the GrenadinesSub-Saharan Africa Sub-Saharan Africa (excluding high income)Sub-Saharan Africa (IDA & IBRD countries)SudanSurinameSwazilandSwedenSwitzerlandSyrian Arab RepublicTajikistanTanzaniaThailandTimor-LesteTogoTongaTrinidad and TobagoTunisiaTurkeyTurks and Caicos IslandsTuvaluUgandaUkraineUnited Arab EmiratesUpper middle incomeUruguayUzbekistanVanuatuVenezuela, RBVietnamWest Bank and GazaWorldYemen, Rep.ZambiaZimbabwe La ligne de temps
Cette échelle de temps montre un graphique de 1974 année à 2014 année Least developed countries: UN classification. Les données jusqu'à 1973 année ne sont pas présentés. Quantité d'observations actuelles selon dates: 41.
Source (désignation):
Les indicateurs du développement mondiale
Source (organisation):
UNESCO Institute for Statistics
Catégories:
Education
Dernière mise à jour
23 avr. 2017
Les indicateurs de changement de valeurs selon les années
Minimum:
52.754
1 janv. 1977
Maximum:
79.77
1 janv. 2008
Pour la date d''observation
Valeur
Changement absolu
Le changement par rapport à la valeur précédente
1 janv. 1974
54.686
+54.686
0.0%
1 janv. 1975
53.137
-1.55
-2.83%
1 janv. 1976
53.092
-0.045
-0.08%
1 janv. 1977
52.754
-0.337
-0.64%
1 janv. 1978
53.271
+0.517
0.98%
1 janv. 1979
53.236
-0.035
-0.07%
1 janv. 1980
54.121
+0.885
1.66%
1 janv. 1981
54.659
+0.539
1.0%
1 janv. 1982
53.344
-1.315
-2.41%
1 janv. 1983
53.148
-0.196
-0.37%
1 janv. 1984
53.857
+0.709
1.33%
1 janv. 1985
53.555
-0.302
-0.56%
1 janv. 1986
56.135
+2.58
4.82%
1 janv. 1987
56.014
-0.12
-0.21%
1 janv. 1988
56.683
+0.669
1.19%
1 janv. 1989
56.697
+0.014
0.02%
1 janv. 1990
56.643
-0.054
-0.1%
1 janv. 1991
56.105
-0.538
-0.95%
1 janv. 1992
56.516
+0.411
0.73%
1 janv. 1993
57.794
+1.278
2.26%
1 janv. 1994
57.886
+0.091
0.16%
1 janv. 1995
59.675
+1.789
3.09%
1 janv. 1996
61.525
+1.85
3.1%
1 janv. 1997
63.407
+1.882
3.06%
1 janv. 1998
65.065
+1.658
2.62%
1 janv. 1999
67.765
+2.699
4.15%
1 janv. 2000
68.397
+0.633
0.93%
1 janv. 2001
70.08
+1.683
2.46%
1 janv. 2002
72.335
+2.255
3.22%
1 janv. 2003
73.03
+0.695
0.96%
1 janv. 2004
75.116
+2.086
2.86%
1 janv. 2005
77.349
+2.234
2.97%
1 janv. 2006
78.434
+1.084
1.4%
1 janv. 2007
79.162
+0.729
0.93%
1 janv. 2008
79.77
+0.608
0.77%
1 janv. 2009
77.396
-2.374
-2.98%
1 janv. 2010
79.165
+1.77
2.29%
1 janv. 2011
78.882
-0.284
-0.36%
1 janv. 2012
79.603
+0.721
0.91%
1 janv. 2013
79.518
-0.085
-0.11%
1 janv. 2014
79.669
+0.151
0.19%
Classement des pays selon les statistiques actuelles par années


Commentaires: