29
/fr/
fr
AIzaSyAYiBZKx7MnpbEhh9jyipgxe19OcubqV5w
April 1, 2024
39833
IDA total
IDA
false
2
1
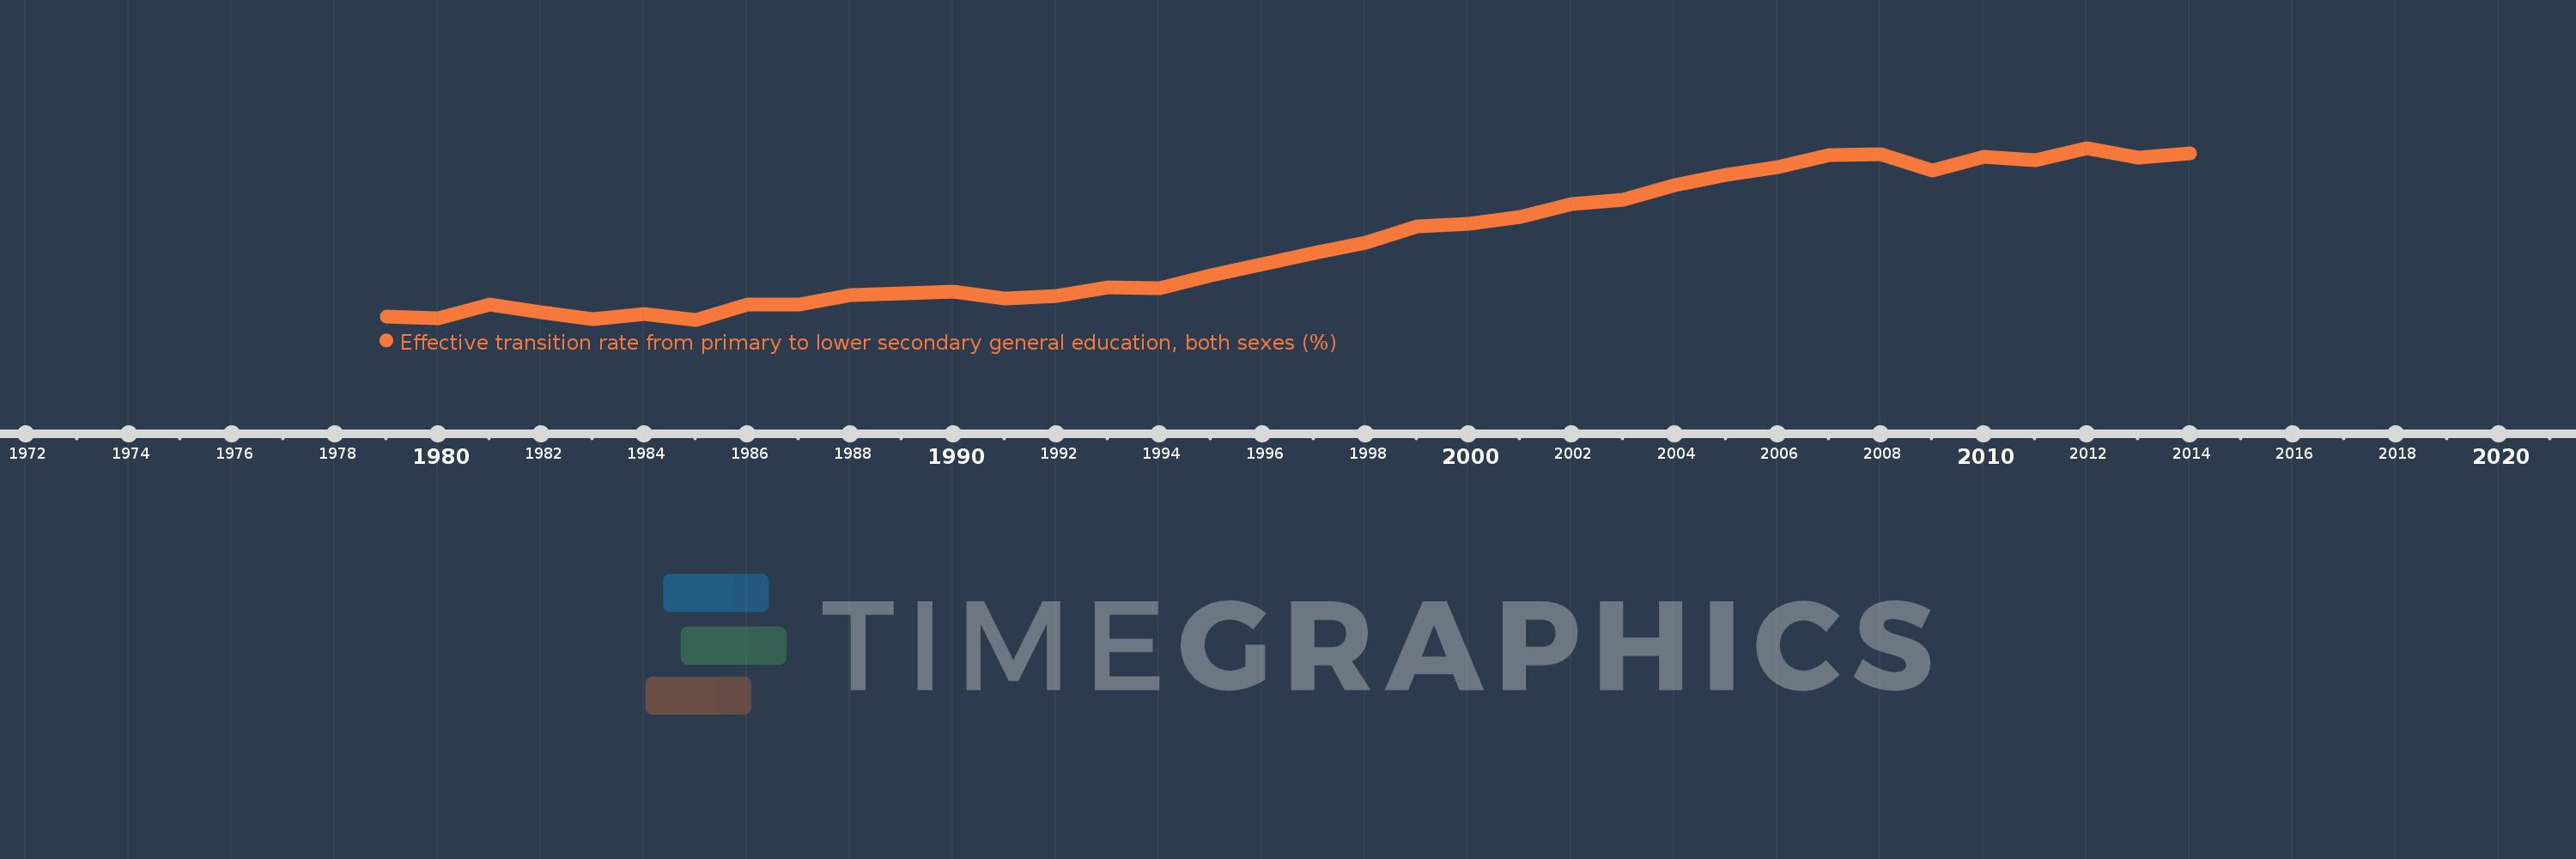
Effective transition rate from primary to lower secondary general education, both sexes (%)
2014,2013,2012,2011,2010,2009,2008,2007,2006,2005,2004,2003,2002,2001,2000,1999,1998,1997,1996,1995,1994,1993,1992,1991,1990,1989,1988,1987,1986,1985,1984,1983,1982,1981,1980,1979
Cette statistique dans les autres pays:
AfghanistanAlbaniaAlgeriaAngolaAntigua and BarbudaArab WorldArgentinaArmeniaArubaAustriaAzerbaijanBahamas, TheBahrainBangladeshBarbadosBelarusBelgiumBelizeBeninBermudaBhutanBoliviaBosnia and HerzegovinaBotswanaBrazilBritish Virgin IslandsBrunei DarussalamBulgariaBurkina FasoBurundiCabo VerdeCambodiaCameroonCaribbean small statesCayman IslandsCentral African RepublicCentral Europe and the BalticsChadChileChinaColombiaComorosCongo, Dem. Rep.Congo, Rep.Costa RicaCote d'IvoireCroatiaCubaCyprusCzech RepublicDenmarkDjiboutiDominicaDominican RepublicEarly-demographic dividendEast Asia & PacificEast Asia & Pacific (excluding high income)East Asia & Pacific (IDA & IBRD countries)EcuadorEgypt, Arab Rep.El SalvadorEquatorial GuineaEritreaEstoniaEthiopiaEuro areaEurope & Central AsiaEurope & Central Asia (excluding high income)Europe & Central Asia (IDA & IBRD countries)European UnionFijiFinlandFragile and conflict affected situationsFranceGabonGambia, TheGeorgiaGermanyGhanaGreeceGrenadaGuatemalaGuineaGuinea-BissauGuyanaHaitiHeavily indebted poor countries (HIPC)High incomeHondurasHong Kong SAR, ChinaHungaryIBRD onlyIcelandIDA & IBRD totalIDA blendIDA onlyIDA totalIndiaIndonesiaIran, Islamic Rep.IraqIsraelItalyJamaicaJapanJordanKazakhstanKenyaKiribatiKorea, Rep.KuwaitKyrgyz RepublicLao PDRLate-demographic dividendLatin America & Caribbean Latin America & Caribbean (excluding high income)Latin America & the Caribbean (IDA & IBRD countries)LatviaLeast developed countries: UN classificationLebanonLesothoLiberiaLibyaLiechtensteinLithuaniaLow & middle incomeLow incomeLower middle incomeLuxembourgMacao SAR, ChinaMacedonia, FYRMadagascarMalawiMalaysiaMaldivesMaliMaltaMarshall IslandsMauritaniaMauritiusMexicoMiddle East & North AfricaMiddle East & North Africa (excluding high income)Middle East & North Africa (IDA & IBRD countries)Middle incomeMoldovaMonacoMongoliaMoroccoMozambiqueMyanmarNamibiaNepalNetherlandsNicaraguaNigerNorwayOECD membersOmanOther small statesPacific island small statesPakistanPalauPanamaParaguayPeruPhilippinesPolandPortugalPost-demographic dividendPre-demographic dividendQatarRomaniaRussian FederationRwandaSamoaSan MarinoSao Tome and PrincipeSaudi ArabiaSenegalSerbiaSeychellesSierra LeoneSingaporeSlovak RepublicSloveniaSmall statesSolomon IslandsSouth AfricaSouth AsiaSouth Asia (IDA & IBRD)SpainSri LankaSt. Kitts and NevisSt. LuciaSt. Vincent and the GrenadinesSub-Saharan Africa Sub-Saharan Africa (excluding high income)Sub-Saharan Africa (IDA & IBRD countries)SudanSurinameSwazilandSwedenSwitzerlandSyrian Arab RepublicTajikistanTanzaniaThailandTimor-LesteTogoTongaTrinidad and TobagoTunisiaTurkeyTurks and Caicos IslandsTuvaluUgandaUkraineUnited Arab EmiratesUpper middle incomeUruguayUzbekistanVanuatuVenezuela, RBVietnamWest Bank and GazaWorldYemen, Rep.ZambiaZimbabwe La ligne de temps
Cette échelle de temps montre un graphique de 1979 année à 2014 année IDA total. Les données jusqu'à 1978 année ne sont pas présentés. Quantité d'observations actuelles selon dates: 36.
Source (désignation):
Les indicateurs du développement mondiale
Source (organisation):
UNESCO Institute for Statistics
Catégories:
Education
Dernière mise à jour
23 avr. 2017
Les indicateurs de changement de valeurs selon les années
Minimum:
66.175
1 janv. 1985
Maximum:
82.25
1 janv. 2012
Pour la date d''observation
Valeur
Changement absolu
Le changement par rapport à la valeur précédente
1 janv. 1979
66.493
+66.493
0.0%
1 janv. 1980
66.311
-0.182
-0.27%
1 janv. 1981
67.596
+1.285
1.94%
1 janv. 1982
66.887
-0.71
-1.05%
1 janv. 1983
66.199
-0.687
-1.03%
1 janv. 1984
66.72
+0.52
0.79%
1 janv. 1985
66.175
-0.544
-0.82%
1 janv. 1986
67.596
+1.421
2.15%
1 janv. 1987
67.564
-0.032
-0.05%
1 janv. 1988
68.448
+0.884
1.31%
1 janv. 1989
68.664
+0.216
0.32%
1 janv. 1990
68.79
+0.126
0.18%
1 janv. 1991
68.18
-0.611
-0.89%
1 janv. 1992
68.378
+0.199
0.29%
1 janv. 1993
69.224
+0.846
1.24%
1 janv. 1994
69.126
-0.099
-0.14%
1 janv. 1995
70.363
+1.237
1.79%
1 janv. 1996
71.396
+1.034
1.47%
1 janv. 1997
72.41
+1.013
1.42%
1 janv. 1998
73.349
+0.939
1.3%
1 janv. 1999
74.93
+1.581
2.16%
1 janv. 2000
75.175
+0.244
0.33%
1 janv. 2001
75.8
+0.625
0.83%
1 janv. 2002
76.967
+1.167
1.54%
1 janv. 2003
77.366
+0.399
0.52%
1 janv. 2004
78.735
+1.369
1.77%
1 janv. 2005
79.698
+0.963
1.22%
1 janv. 2006
80.473
+0.775
0.97%
1 janv. 2007
81.585
+1.112
1.38%
1 janv. 2008
81.648
+0.063
0.08%
1 janv. 2009
80.166
-1.482
-1.82%
1 janv. 2010
81.435
+1.27
1.58%
1 janv. 2011
81.077
-0.358
-0.44%
1 janv. 2012
82.25
+1.173
1.45%
1 janv. 2013
81.35
-0.9
-1.09%
1 janv. 2014
81.731
+0.381
0.47%
Classement des pays selon les statistiques actuelles par années


Commentaires: