30
/fr/
AIzaSyAYiBZKx7MnpbEhh9jyipgxe19OcubqV5w
April 1, 2024
42286
Latin America & Caribbean (excluding high income)
LAC
false
2
1
Employers, female (% of female employment)
2013,2012,2010,2009,2008,2007,2006,2005,2004,2003,2002,2001,1997,1996,1994
Download
Bibliothèque de statistiques globales →Latin America & Caribbean (excluding high income) →

Employers, female (% of female employment)

Cette statistique dans les autres pays:

AlbaniaAlgeriaAmerican SamoaAntigua and BarbudaArgentinaArmeniaArubaAustriaAzerbaijanBahrainBangladeshBarbadosBelarusBelgiumBelizeBeninBermudaBhutanBoliviaBotswanaBrazilBritish Virgin IslandsBrunei DarussalamBulgariaBurkina FasoBurundiCabo VerdeCambodiaCameroonCaribbean small statesCayman IslandsCentral Europe and the BalticsChadChileColombiaCongo, Rep.Costa RicaCote d'IvoireCroatiaCyprusCzech RepublicDenmarkDjiboutiDominicaDominican RepublicEarly-demographic dividendEcuadorEgypt, Arab Rep.El SalvadorEstoniaEthiopiaEuro areaEurope & Central AsiaEurope & Central Asia (excluding high income)Europe & Central Asia (IDA & IBRD countries)European UnionFijiFinlandFranceGabonGambia, TheGeorgiaGermanyGhanaGreeceGrenadaGuatemalaGuineaHondurasHong Kong SAR, ChinaHungaryIcelandIndiaIndonesiaIran, Islamic Rep.IrelandIsle of ManItalyJamaicaJordanKazakhstanKiribatiKosovoKuwaitKyrgyz RepublicLao PDRLatin America & Caribbean Latin America & Caribbean (excluding high income)Latin America & the Caribbean (IDA & IBRD countries)LatviaLebanonLesothoLiberiaLithuaniaLower middle incomeLuxembourgMacao SAR, ChinaMacedonia, FYRMadagascarMalawiMalaysiaMaldivesMaliMaltaMarshall IslandsMauritiusMiddle East & North Africa (excluding high income)Middle East & North Africa (IDA & IBRD countries)MoldovaMongoliaMoroccoMozambiqueNamibiaNepalNetherlandsNicaraguaNigerNorwayOmanPakistanPanamaParaguayPeruPhilippinesPolandPortugalQatarRomaniaRussian FederationRwandaSamoaSan MarinoSao Tome and PrincipeSaudi ArabiaSenegalSerbiaSeychellesSingaporeSlovak RepublicSloveniaSouth AfricaSouth AsiaSouth Asia (IDA & IBRD)SpainSri LankaSt. Kitts and NevisSt. LuciaSt. Vincent and the GrenadinesSurinameSwazilandSwedenSwitzerlandSyrian Arab RepublicTajikistanTanzaniaThailandTimor-LesteTongaTrinidad and TobagoTunisiaTurkeyTurks and Caicos IslandsTuvaluUgandaUkraineUnited Arab EmiratesUnited KingdomUruguayVanuatuVenezuela, RBVietnamWest Bank and GazaYemen, Rep.ZambiaZimbabwe

La ligne de temps

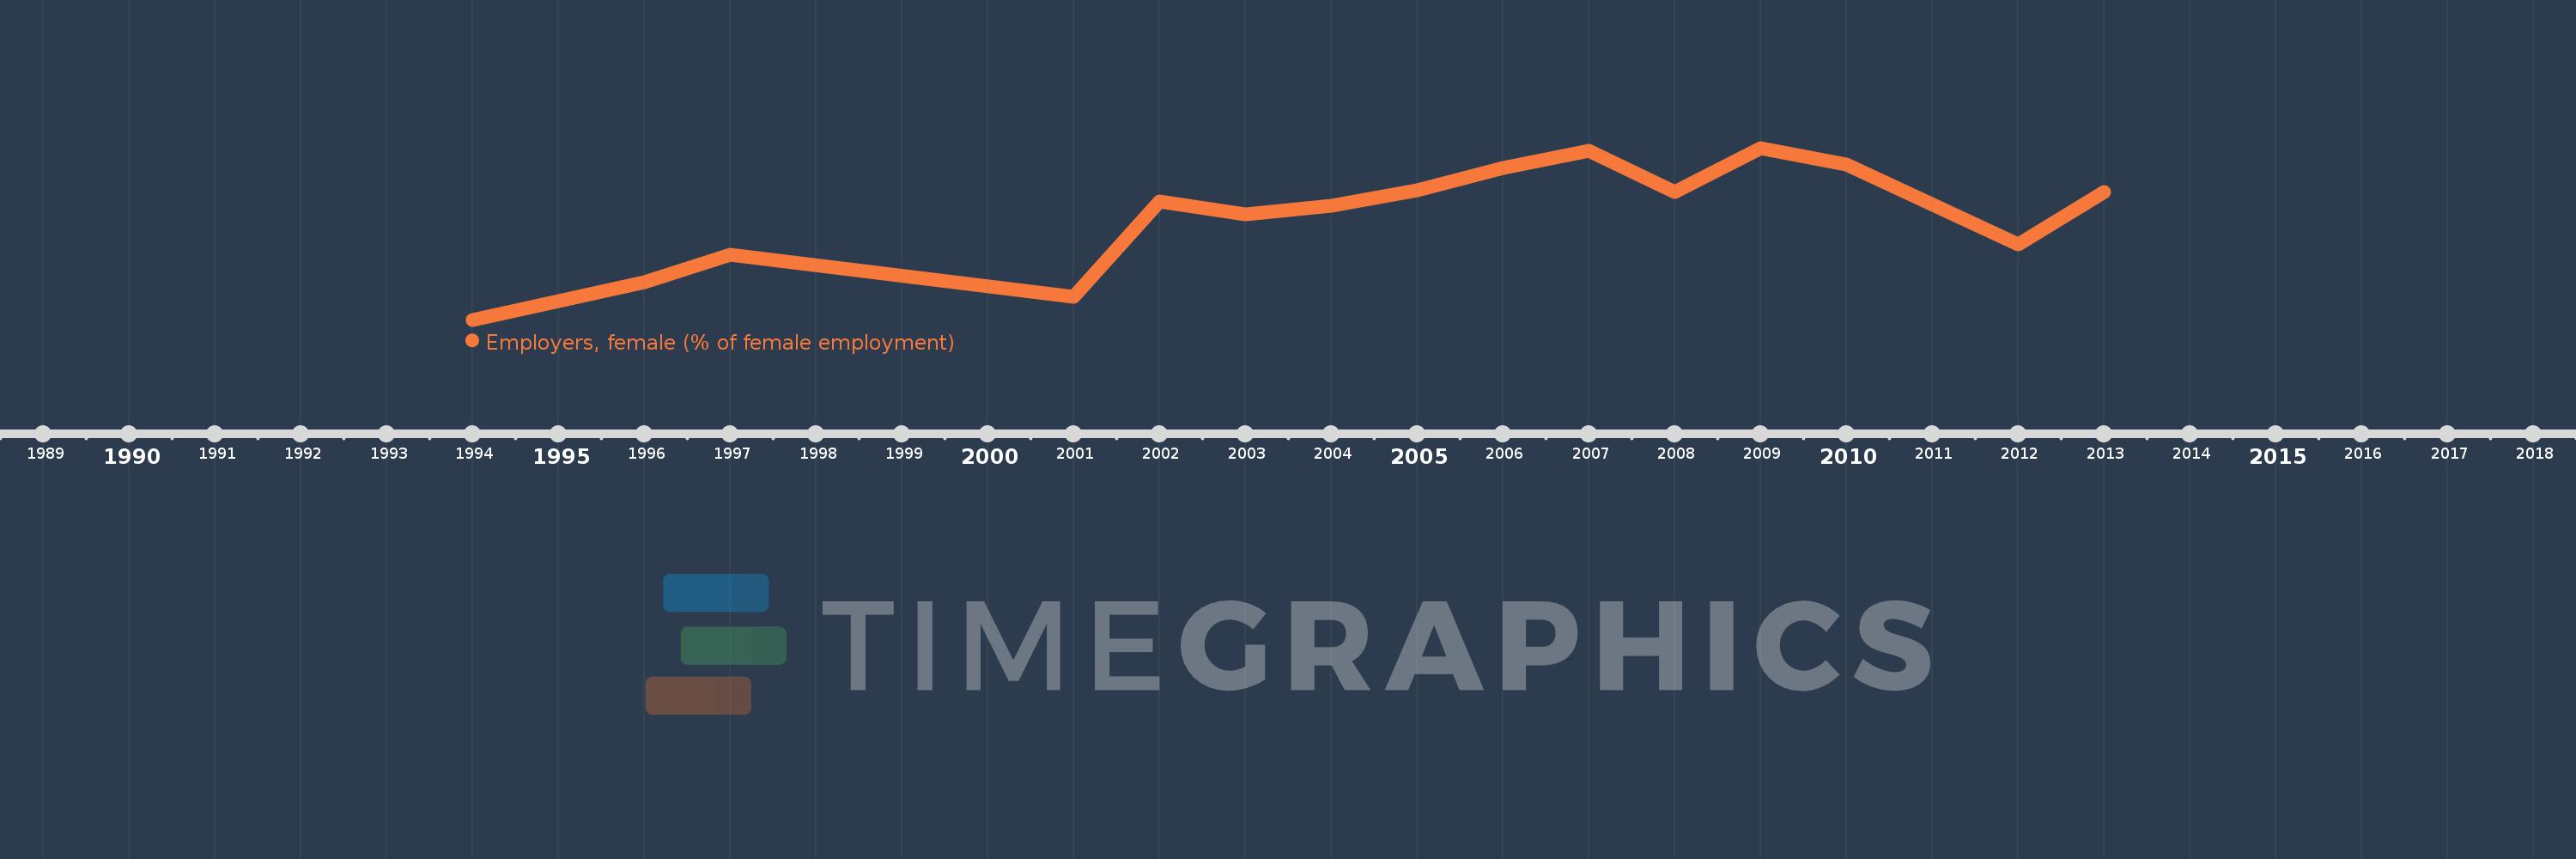
Cette échelle de temps montre un graphique de 1994 année à 2013 année Latin America & Caribbean (excluding high income). Les données jusqu'à 1993 année ne sont pas présentés. Quantité d'observations actuelles selon dates: 15.

Source (désignation):

Les indicateurs du développement mondiale

Source (organisation):

ILO Key Indicators of the Labour Market (KILM).

Catégories:

Social Protection & Labor, Gender

Dernière mise à jour

23 avr. 2017

Les indicateurs de changement de valeurs selon les années

En moyenne:
2.502
Minimum:
2.068
1 janv. 1994
Maximum:
2.779
1 janv. 2009
Pour la date d''observation
Valeur
Changement absolu
Le changement par rapport à la valeur précédente
1 janv. 1994
2.068
+2.068
0.0%
1 janv. 1996
2.224
+0.155
7.52%
1 janv. 1997
2.338
+0.114
5.13%
1 janv. 2001
2.163
-0.174
-7.46%
1 janv. 2002
2.558
+0.395
18.27%
1 janv. 2003
2.505
-0.054
-2.11%
1 janv. 2004
2.538
+0.033
1.33%
1 janv. 2005
2.603
+0.066
2.58%
1 janv. 2006
2.695
+0.092
3.53%
1 janv. 2007
2.768
+0.072
2.69%
1 janv. 2008
2.598
-0.17
-6.14%
1 janv. 2009
2.779
+0.181
6.96%
1 janv. 2010
2.711
-0.068
-2.44%
1 janv. 2012
2.379
-0.332
-12.25%
1 janv. 2013
2.598
+0.219
9.21%

Classement des pays selon les statistiques actuelles par années