29
/fr/
fr
AIzaSyAYiBZKx7MnpbEhh9jyipgxe19OcubqV5w
April 1, 2024
41366
Latin America & Caribbean
LCN
false
2
1
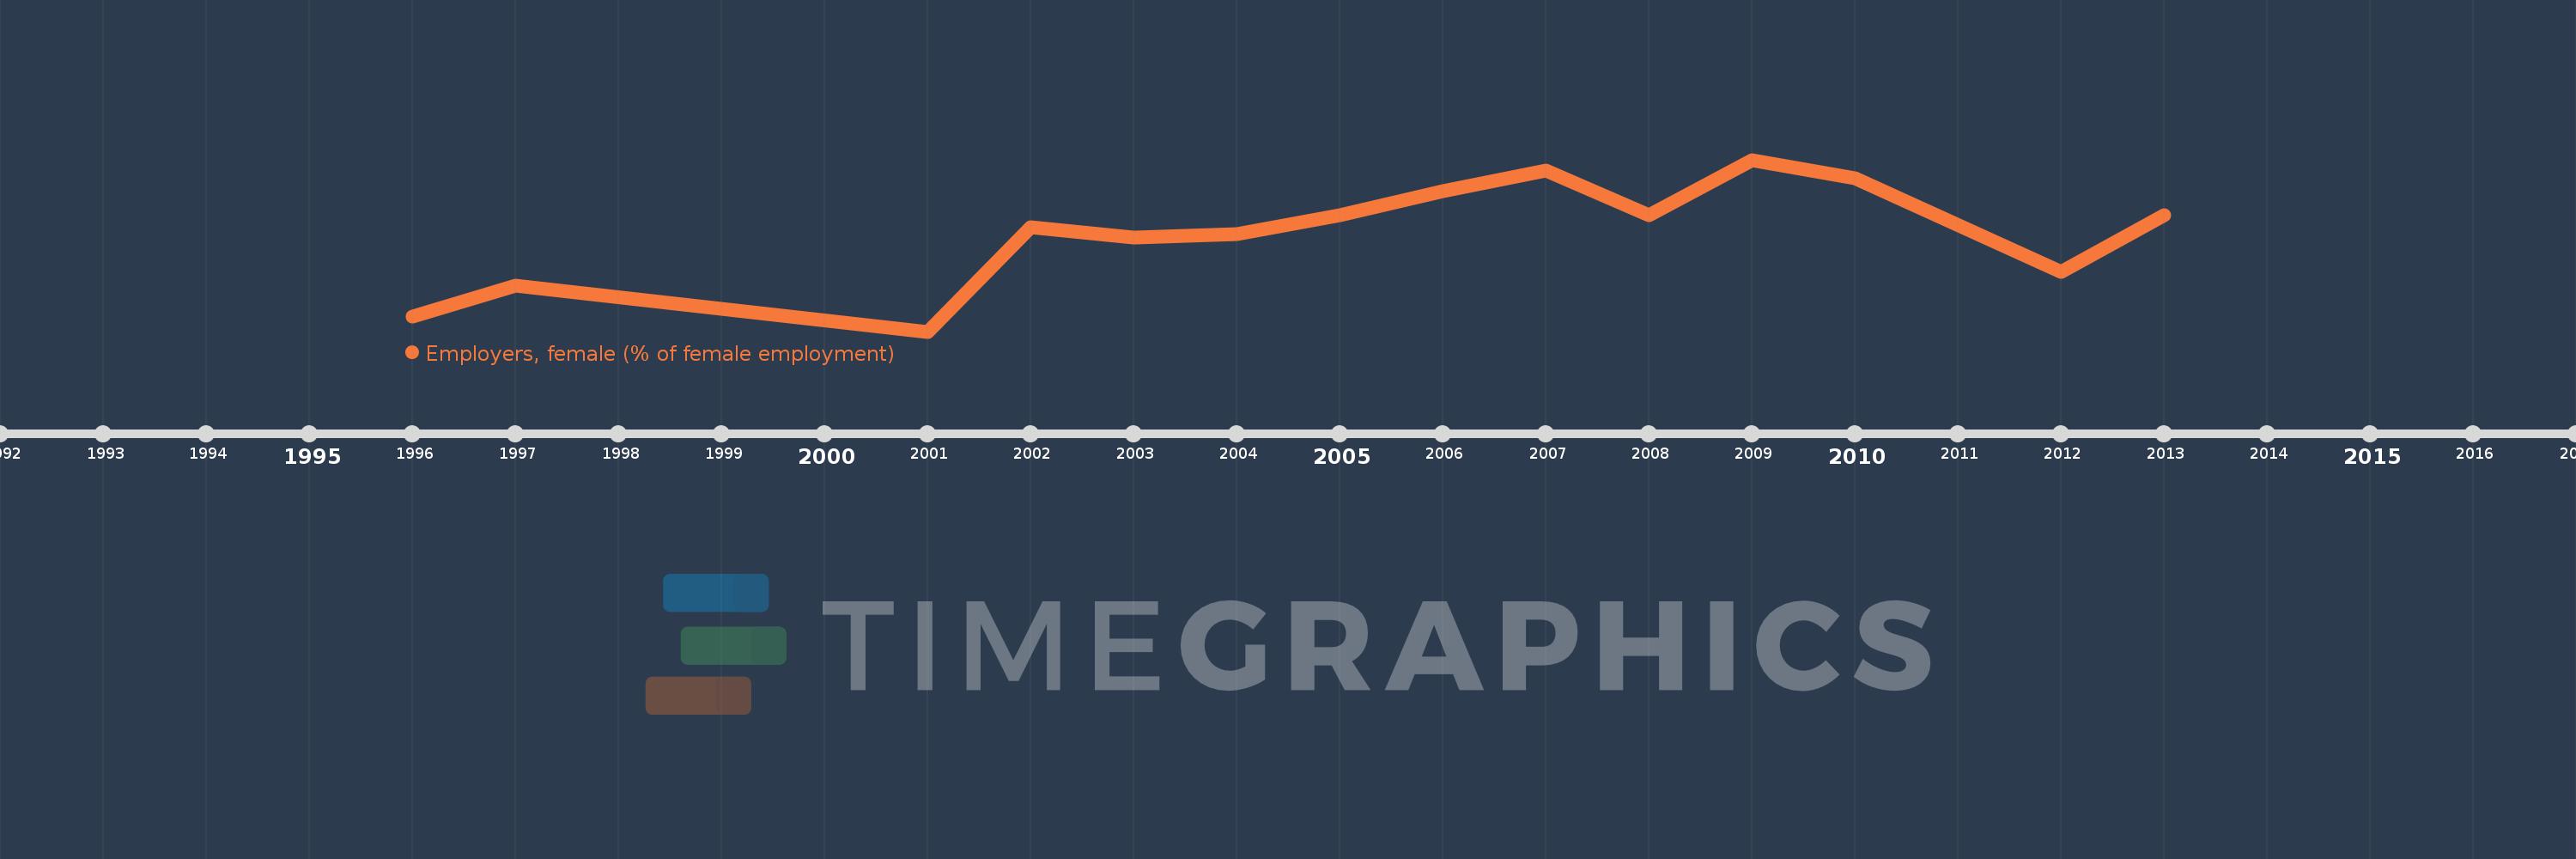
Employers, female (% of female employment)
2013,2012,2010,2009,2008,2007,2006,2005,2004,2003,2002,2001,1997,1996
Cette statistique dans les autres pays:
La ligne de temps
Cette échelle de temps montre un graphique de 1996 année à 2013 année Latin America & Caribbean . Les données jusqu'à 1995 année ne sont pas présentés. Quantité d'observations actuelles selon dates: 14.
Source (désignation):
Les indicateurs du développement mondiale
Source (organisation):
ILO Key Indicators of the Labour Market (KILM).
Catégories:
Social Protection & Labor, Gender
Dernière mise à jour
23 avr. 2017
Les indicateurs de changement de valeurs selon les années
Minimum:
2.163
1 janv. 2001
Maximum:
2.809
1 janv. 2009
Pour la date d''observation
Valeur
Changement absolu
Le changement par rapport à la valeur précédente
1 janv. 1996
2.221
+2.221
0.0%
1 janv. 1997
2.335
+0.114
5.14%
1 janv. 2001
2.163
-0.172
-7.38%
1 janv. 2002
2.555
+0.392
18.1%
1 janv. 2003
2.516
-0.038
-1.49%
1 janv. 2004
2.53
+0.013
0.52%
1 janv. 2005
2.601
+0.071
2.82%
1 janv. 2006
2.692
+0.092
3.52%
1 janv. 2007
2.768
+0.076
2.82%
1 janv. 2008
2.6
-0.168
-6.06%
1 janv. 2009
2.809
+0.208
8.01%
1 janv. 2010
2.74
-0.068
-2.43%
1 janv. 2012
2.387
-0.354
-12.91%
1 janv. 2013
2.6
+0.214
8.96%
Classement des pays selon les statistiques actuelles par années


Commentaires: