29
/fr/
fr
AIzaSyAYiBZKx7MnpbEhh9jyipgxe19OcubqV5w
April 1, 2024
41995
Latin America & Caribbean
LCN
false
2
1
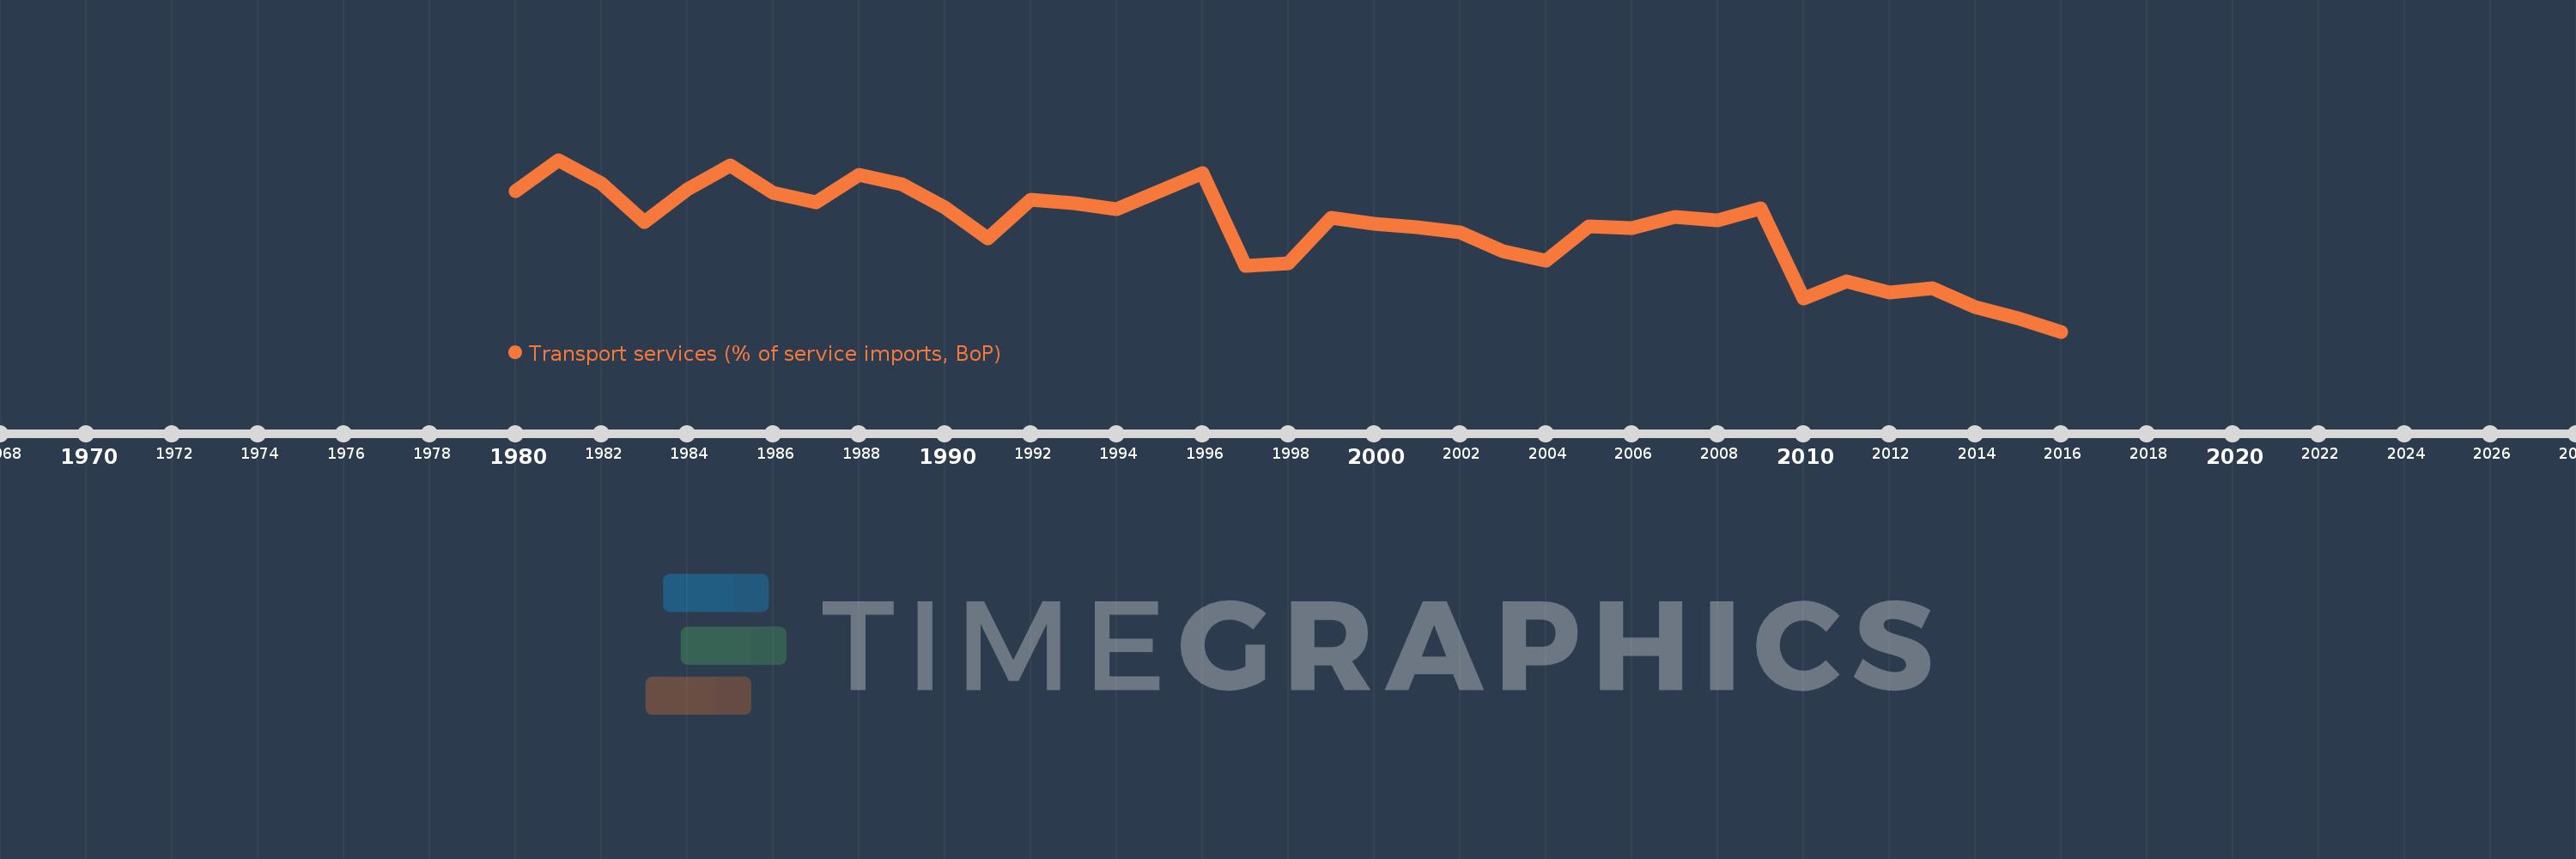
Transport services (% of service imports, BoP)
2016,2015,2014,2013,2012,2011,2010,2009,2008,2007,2006,2005,2004,2003,2002,2001,2000,1999,1998,1997,1996,1995,1994,1993,1992,1991,1990,1989,1988,1987,1986,1985,1984,1983,1982,1981,1980
Cette statistique dans les autres pays:
AfghanistanAlbaniaAlgeriaAngolaAntigua and BarbudaArab WorldArgentinaArmeniaArubaAustraliaAustriaAzerbaijanBahamas, TheBahrainBangladeshBarbadosBelarusBelgiumBelizeBeninBermudaBhutanBoliviaBosnia and HerzegovinaBotswanaBrazilBrunei DarussalamBulgariaBurkina FasoBurundiCabo VerdeCambodiaCameroonCanadaCaribbean small statesCentral African RepublicCentral Europe and the BalticsChadChileChinaColombiaComorosCongo, Dem. Rep.Congo, Rep.Costa RicaCote d'IvoireCroatiaCuracaoCyprusCzech RepublicDenmarkDjiboutiDominicaDominican RepublicEarly-demographic dividendEast Asia & PacificEast Asia & Pacific (excluding high income)East Asia & Pacific (IDA & IBRD countries)EcuadorEgypt, Arab Rep.El SalvadorEquatorial GuineaEritreaEstoniaEthiopiaEuro areaEurope & Central AsiaEurope & Central Asia (excluding high income)Europe & Central Asia (IDA & IBRD countries)European UnionFaroe IslandsFijiFinlandFragile and conflict affected situationsFranceFrench PolynesiaGabonGambia, TheGeorgiaGermanyGhanaGreeceGrenadaGuatemalaGuineaGuinea-BissauGuyanaHaitiHeavily indebted poor countries (HIPC)High incomeHondurasHong Kong SAR, ChinaHungaryIBRD onlyIcelandIDA & IBRD totalIDA onlyIDA totalIndiaIndonesiaIran, Islamic Rep.IraqIrelandIsraelItalyJamaicaJapanJordanKazakhstanKenyaKiribatiKorea, Rep.KosovoKuwaitKyrgyz RepublicLao PDRLate-demographic dividendLatin America & Caribbean Latin America & Caribbean (excluding high income)Latin America & the Caribbean (IDA & IBRD countries)LatviaLeast developed countries: UN classificationLebanonLesothoLiberiaLibyaLithuaniaLow & middle incomeLow incomeLower middle incomeLuxembourgMacao SAR, ChinaMacedonia, FYRMadagascarMalawiMalaysiaMaldivesMaliMaltaMarshall IslandsMauritaniaMauritiusMexicoMicronesia, Fed. Sts.Middle East & North AfricaMiddle East & North Africa (excluding high income)Middle East & North Africa (IDA & IBRD countries)Middle incomeMoldovaMongoliaMontenegroMoroccoMozambiqueMyanmarNamibiaNepalNetherlandsNew CaledoniaNew ZealandNicaraguaNigerNigeriaNorth AmericaNorwayOECD membersOmanOther small statesPacific island small statesPakistanPalauPanamaPapua New GuineaParaguayPeruPhilippinesPolandPortugalPost-demographic dividendPre-demographic dividendQatarRomaniaRussian FederationRwandaSamoaSao Tome and PrincipeSaudi ArabiaSenegalSerbiaSeychellesSierra LeoneSingaporeSint Maarten (Dutch part)Slovak RepublicSloveniaSmall statesSolomon IslandsSouth AfricaSouth AsiaSouth Asia (IDA & IBRD)South SudanSpainSri LankaSt. Kitts and NevisSt. LuciaSt. Vincent and the GrenadinesSub-Saharan Africa Sub-Saharan Africa (excluding high income)Sub-Saharan Africa (IDA & IBRD countries)SudanSurinameSwazilandSwedenSwitzerlandSyrian Arab RepublicTajikistanTanzaniaThailandTimor-LesteTogoTongaTrinidad and TobagoTunisiaTurkeyTuvaluUgandaUkraineUnited KingdomUnited StatesUpper middle incomeUruguayVanuatuVenezuela, RBWest Bank and GazaWorldYemen, Rep.ZambiaZimbabwe La ligne de temps
Cette échelle de temps montre un graphique de 1980 année à 2016 année Latin America & Caribbean . Les données jusqu'à 1979 année ne sont pas présentés. Quantité d'observations actuelles selon dates: 37.
Source (désignation):
Les indicateurs du développement mondiale
Source (organisation):
International Monetary Fund, Balance of Payments Statistics Yearbook and data files.
Catégories:
Economy & Growth, Trade
Dernière mise à jour
23 avr. 2017
Les indicateurs de changement de valeurs selon les années
Minimum:
27.788
1 janv. 2016
Maximum:
40.417
1 janv. 1981
Pour la date d''observation
Valeur
Changement absolu
Le changement par rapport à la valeur précédente
1 janv. 1980
38.099
+38.099
0.0%
1 janv. 1981
40.417
+2.318
6.08%
1 janv. 1982
38.676
-1.741
-4.31%
1 janv. 1983
35.844
-2.832
-7.32%
1 janv. 1984
38.229
+2.385
6.66%
1 janv. 1985
40.027
+1.798
4.7%
1 janv. 1986
37.99
-2.036
-5.09%
1 janv. 1987
37.306
-0.685
-1.8%
1 janv. 1988
39.317
+2.011
5.39%
1 janv. 1989
38.64
-0.676
-1.72%
1 janv. 1990
36.922
-1.718
-4.45%
1 janv. 1991
34.662
-2.26
-6.12%
1 janv. 1992
37.503
+2.841
8.2%
1 janv. 1993
37.248
-0.255
-0.68%
1 janv. 1994
36.81
-0.438
-1.17%
1 janv. 1995
38.141
+1.331
3.62%
1 janv. 1996
39.431
+1.29
3.38%
1 janv. 1997
32.617
-6.814
-17.28%
1 janv. 1998
32.789
+0.172
0.53%
1 janv. 1999
36.149
+3.36
10.25%
1 janv. 2000
35.696
-0.453
-1.25%
1 janv. 2001
35.437
-0.259
-0.73%
1 janv. 2002
35.077
-0.36
-1.02%
1 janv. 2003
33.716
-1.362
-3.88%
1 janv. 2004
33.005
-0.71
-2.11%
1 janv. 2005
35.515
+2.51
7.61%
1 janv. 2006
35.419
-0.096
-0.27%
1 janv. 2007
36.21
+0.791
2.23%
1 janv. 2008
35.984
-0.227
-0.63%
1 janv. 2009
36.869
+0.885
2.46%
1 janv. 2010
30.203
-6.665
-18.08%
1 janv. 2011
31.453
+1.249
4.14%
1 janv. 2012
30.645
-0.808
-2.57%
1 janv. 2013
30.973
+0.328
1.07%
1 janv. 2014
29.576
-1.397
-4.51%
1 janv. 2015
28.765
-0.81
-2.74%
1 janv. 2016
27.788
-0.977
-3.4%
Classement des pays selon les statistiques actuelles par années


Commentaires: