29
/fr/
fr
AIzaSyAYiBZKx7MnpbEhh9jyipgxe19OcubqV5w
April 1, 2024
268817
Tunisia
TUN
true
2
1
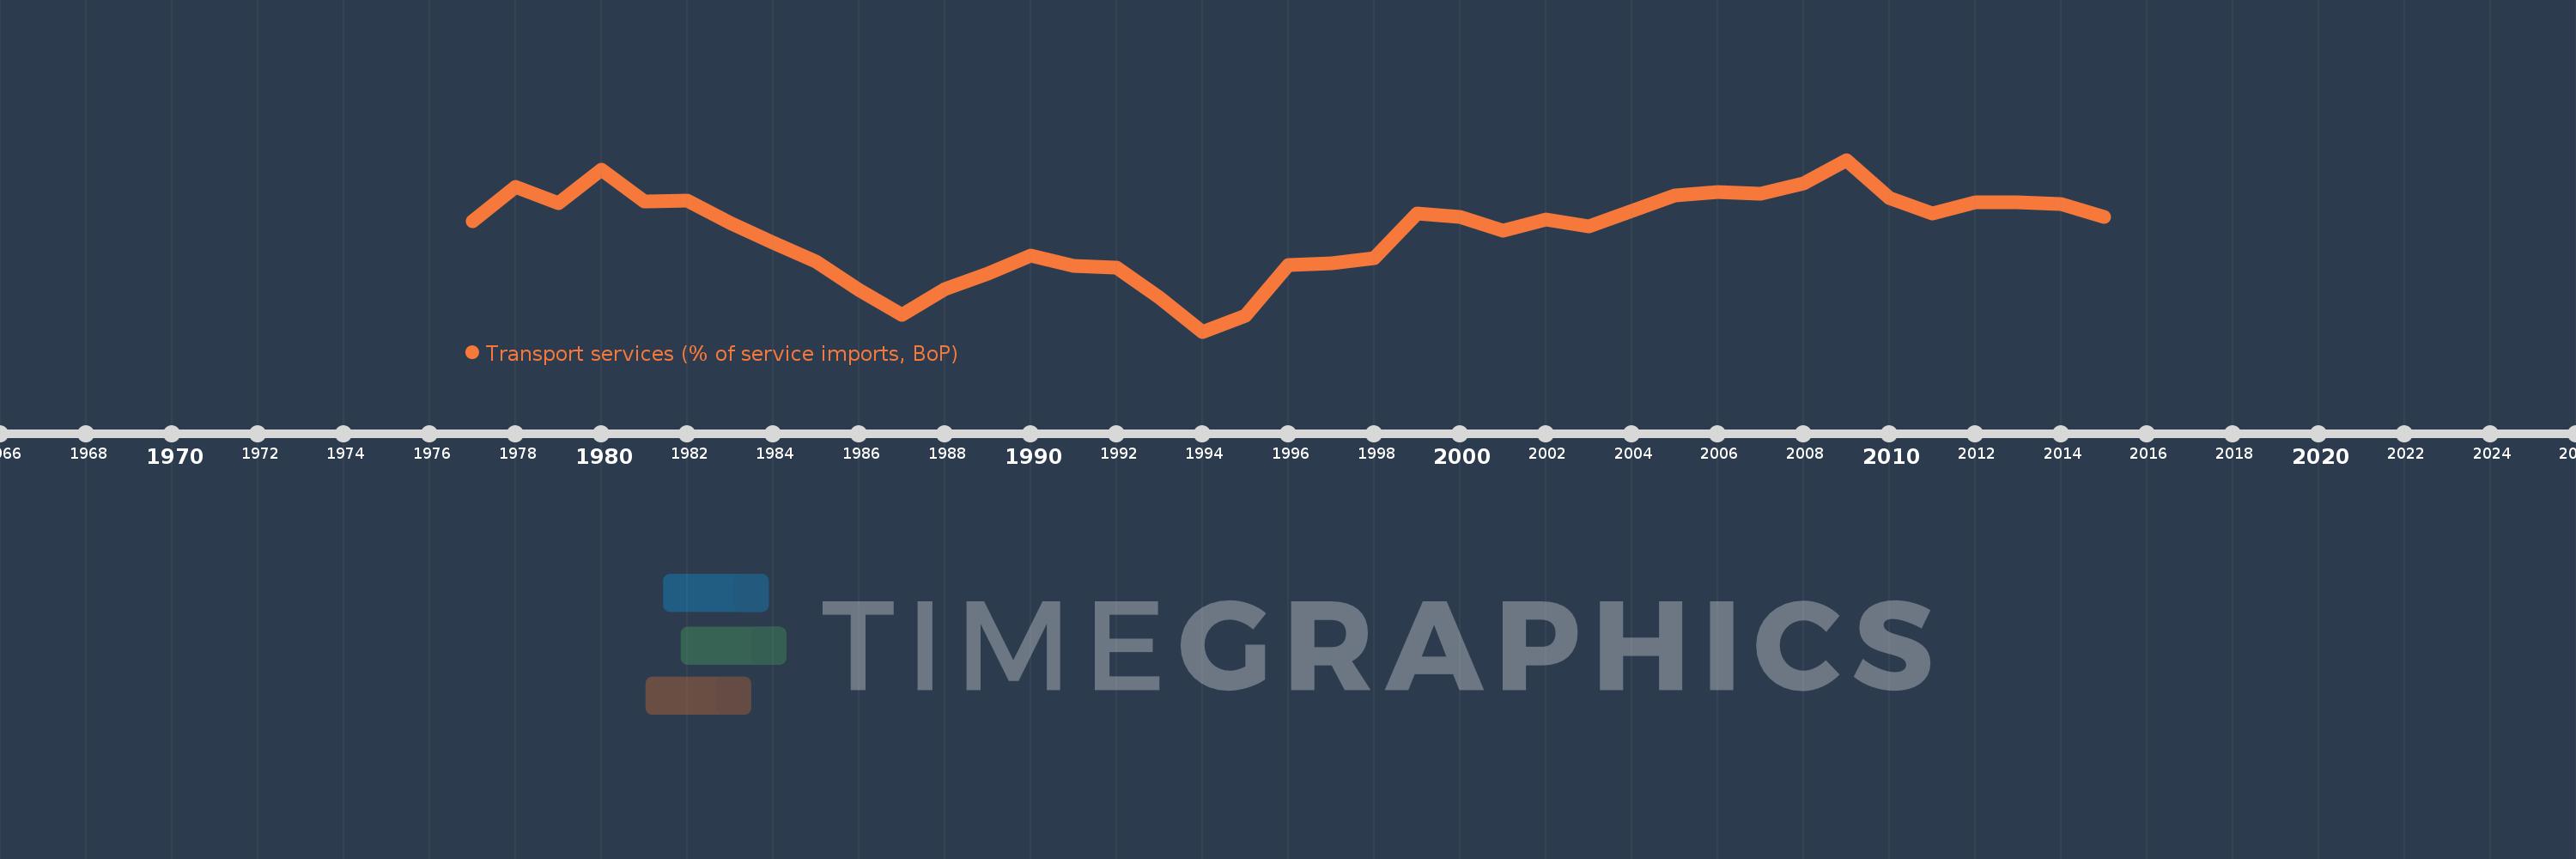
Transport services (% of service imports, BoP)
2015,2014,2013,2012,2011,2010,2009,2008,2007,2006,2005,2004,2003,2002,2001,2000,1999,1998,1997,1996,1995,1994,1993,1992,1991,1990,1989,1988,1987,1986,1985,1984,1983,1982,1981,1980,1979,1978,1977
Cette statistique dans les autres pays:
AfghanistanAlbaniaAlgeriaAngolaAntigua and BarbudaArab WorldArgentinaArmeniaArubaAustraliaAustriaAzerbaijanBahamas, TheBahrainBangladeshBarbadosBelarusBelgiumBelizeBeninBermudaBhutanBoliviaBosnia and HerzegovinaBotswanaBrazilBrunei DarussalamBulgariaBurkina FasoBurundiCabo VerdeCambodiaCameroonCanadaCaribbean small statesCentral African RepublicCentral Europe and the BalticsChadChileChinaColombiaComorosCongo, Dem. Rep.Congo, Rep.Costa RicaCote d'IvoireCroatiaCuracaoCyprusCzech RepublicDenmarkDjiboutiDominicaDominican RepublicEarly-demographic dividendEast Asia & PacificEast Asia & Pacific (excluding high income)East Asia & Pacific (IDA & IBRD countries)EcuadorEgypt, Arab Rep.El SalvadorEquatorial GuineaEritreaEstoniaEthiopiaEuro areaEurope & Central AsiaEurope & Central Asia (excluding high income)Europe & Central Asia (IDA & IBRD countries)European UnionFaroe IslandsFijiFinlandFragile and conflict affected situationsFranceFrench PolynesiaGabonGambia, TheGeorgiaGermanyGhanaGreeceGrenadaGuatemalaGuineaGuinea-BissauGuyanaHaitiHeavily indebted poor countries (HIPC)High incomeHondurasHong Kong SAR, ChinaHungaryIBRD onlyIcelandIDA & IBRD totalIDA onlyIDA totalIndiaIndonesiaIran, Islamic Rep.IraqIrelandIsraelItalyJamaicaJapanJordanKazakhstanKenyaKiribatiKorea, Rep.KosovoKuwaitKyrgyz RepublicLao PDRLate-demographic dividendLatin America & Caribbean Latin America & Caribbean (excluding high income)Latin America & the Caribbean (IDA & IBRD countries)LatviaLeast developed countries: UN classificationLebanonLesothoLiberiaLibyaLithuaniaLow & middle incomeLow incomeLower middle incomeLuxembourgMacao SAR, ChinaMacedonia, FYRMadagascarMalawiMalaysiaMaldivesMaliMaltaMarshall IslandsMauritaniaMauritiusMexicoMicronesia, Fed. Sts.Middle East & North AfricaMiddle East & North Africa (excluding high income)Middle East & North Africa (IDA & IBRD countries)Middle incomeMoldovaMongoliaMontenegroMoroccoMozambiqueMyanmarNamibiaNepalNetherlandsNew CaledoniaNew ZealandNicaraguaNigerNigeriaNorth AmericaNorwayOECD membersOmanOther small statesPacific island small statesPakistanPalauPanamaPapua New GuineaParaguayPeruPhilippinesPolandPortugalPost-demographic dividendPre-demographic dividendQatarRomaniaRussian FederationRwandaSamoaSao Tome and PrincipeSaudi ArabiaSenegalSerbiaSeychellesSierra LeoneSingaporeSint Maarten (Dutch part)Slovak RepublicSloveniaSmall statesSolomon IslandsSouth AfricaSouth AsiaSouth Asia (IDA & IBRD)South SudanSpainSri LankaSt. Kitts and NevisSt. LuciaSt. Vincent and the GrenadinesSub-Saharan Africa Sub-Saharan Africa (excluding high income)Sub-Saharan Africa (IDA & IBRD countries)SudanSurinameSwazilandSwedenSwitzerlandSyrian Arab RepublicTajikistanTanzaniaThailandTimor-LesteTogoTongaTrinidad and TobagoTunisiaTurkeyTuvaluUgandaUkraineUnited KingdomUnited StatesUpper middle incomeUruguayVanuatuVenezuela, RBWest Bank and GazaWorldYemen, Rep.ZambiaZimbabwe La ligne de temps
Cette échelle de temps montre un graphique de 1977 année à 2015 année Tunisia. Les données jusqu'à 1976 année ne sont pas présentés. Quantité d'observations actuelles selon dates: 39.
Source (désignation):
Les indicateurs du développement mondiale
Source (organisation):
International Monetary Fund, Balance of Payments Statistics Yearbook and data files.
Catégories:
Economy & Growth, Trade
Dernière mise à jour
23 avr. 2017
Les indicateurs de changement de valeurs selon les années
Minimum:
31.668
1 janv. 1994
Maximum:
57.352
1 janv. 2009
Pour la date d''observation
Valeur
Changement absolu
Le changement par rapport à la valeur précédente
1 janv. 1977
48.11
+48.11
0.0%
1 janv. 1978
53.333
+5.223
10.86%
1 janv. 1979
50.921
-2.412
-4.52%
1 janv. 1980
55.856
+4.935
9.69%
1 janv. 1981
51.111
-4.745
-8.5%
1 janv. 1982
51.224
+0.113
0.22%
1 janv. 1983
47.895
-3.329
-6.5%
1 janv. 1984
44.976
-2.919
-6.09%
1 janv. 1985
42.147
-2.829
-6.29%
1 janv. 1986
37.945
-4.202
-9.97%
1 janv. 1987
34.211
-3.735
-9.84%
1 janv. 1988
38.0
+3.789
11.08%
1 janv. 1989
40.28
+2.28
6.0%
1 janv. 1990
43.088
+2.808
6.97%
1 janv. 1991
41.454
-1.635
-3.79%
1 janv. 1992
41.26
-0.194
-0.47%
1 janv. 1993
36.719
-4.541
-11.01%
1 janv. 1994
31.668
-5.051
-13.76%
1 janv. 1995
34.06
+2.392
7.55%
1 janv. 1996
41.673
+7.614
22.35%
1 janv. 1997
41.866
+0.193
0.46%
1 janv. 1998
42.617
+0.75
1.79%
1 janv. 1999
49.304
+6.687
15.69%
1 janv. 2000
48.854
-0.45
-0.91%
1 janv. 2001
46.82
-2.033
-4.16%
1 janv. 2002
48.48
+1.66
3.54%
1 janv. 2003
47.347
-1.133
-2.34%
1 janv. 2004
49.773
+2.426
5.12%
1 janv. 2005
52.071
+2.298
4.62%
1 janv. 2006
52.543
+0.472
0.91%
1 janv. 2007
52.29
-0.253
-0.48%
1 janv. 2008
53.842
+1.551
2.97%
1 janv. 2009
57.352
+3.51
6.52%
1 janv. 2010
51.681
-5.67
-9.89%
1 janv. 2011
49.312
-2.369
-4.58%
1 janv. 2012
50.94
+1.628
3.3%
1 janv. 2013
51.053
+0.113
0.22%
1 janv. 2014
50.735
-0.318
-0.62%
1 janv. 2015
48.787
-1.947
-3.84%
Classement des pays selon les statistiques actuelles par années


Commentaires: