29
/fr/
fr
AIzaSyAYiBZKx7MnpbEhh9jyipgxe19OcubqV5w
April 1, 2024
41272
Latin America & Caribbean
LCN
false
2
1
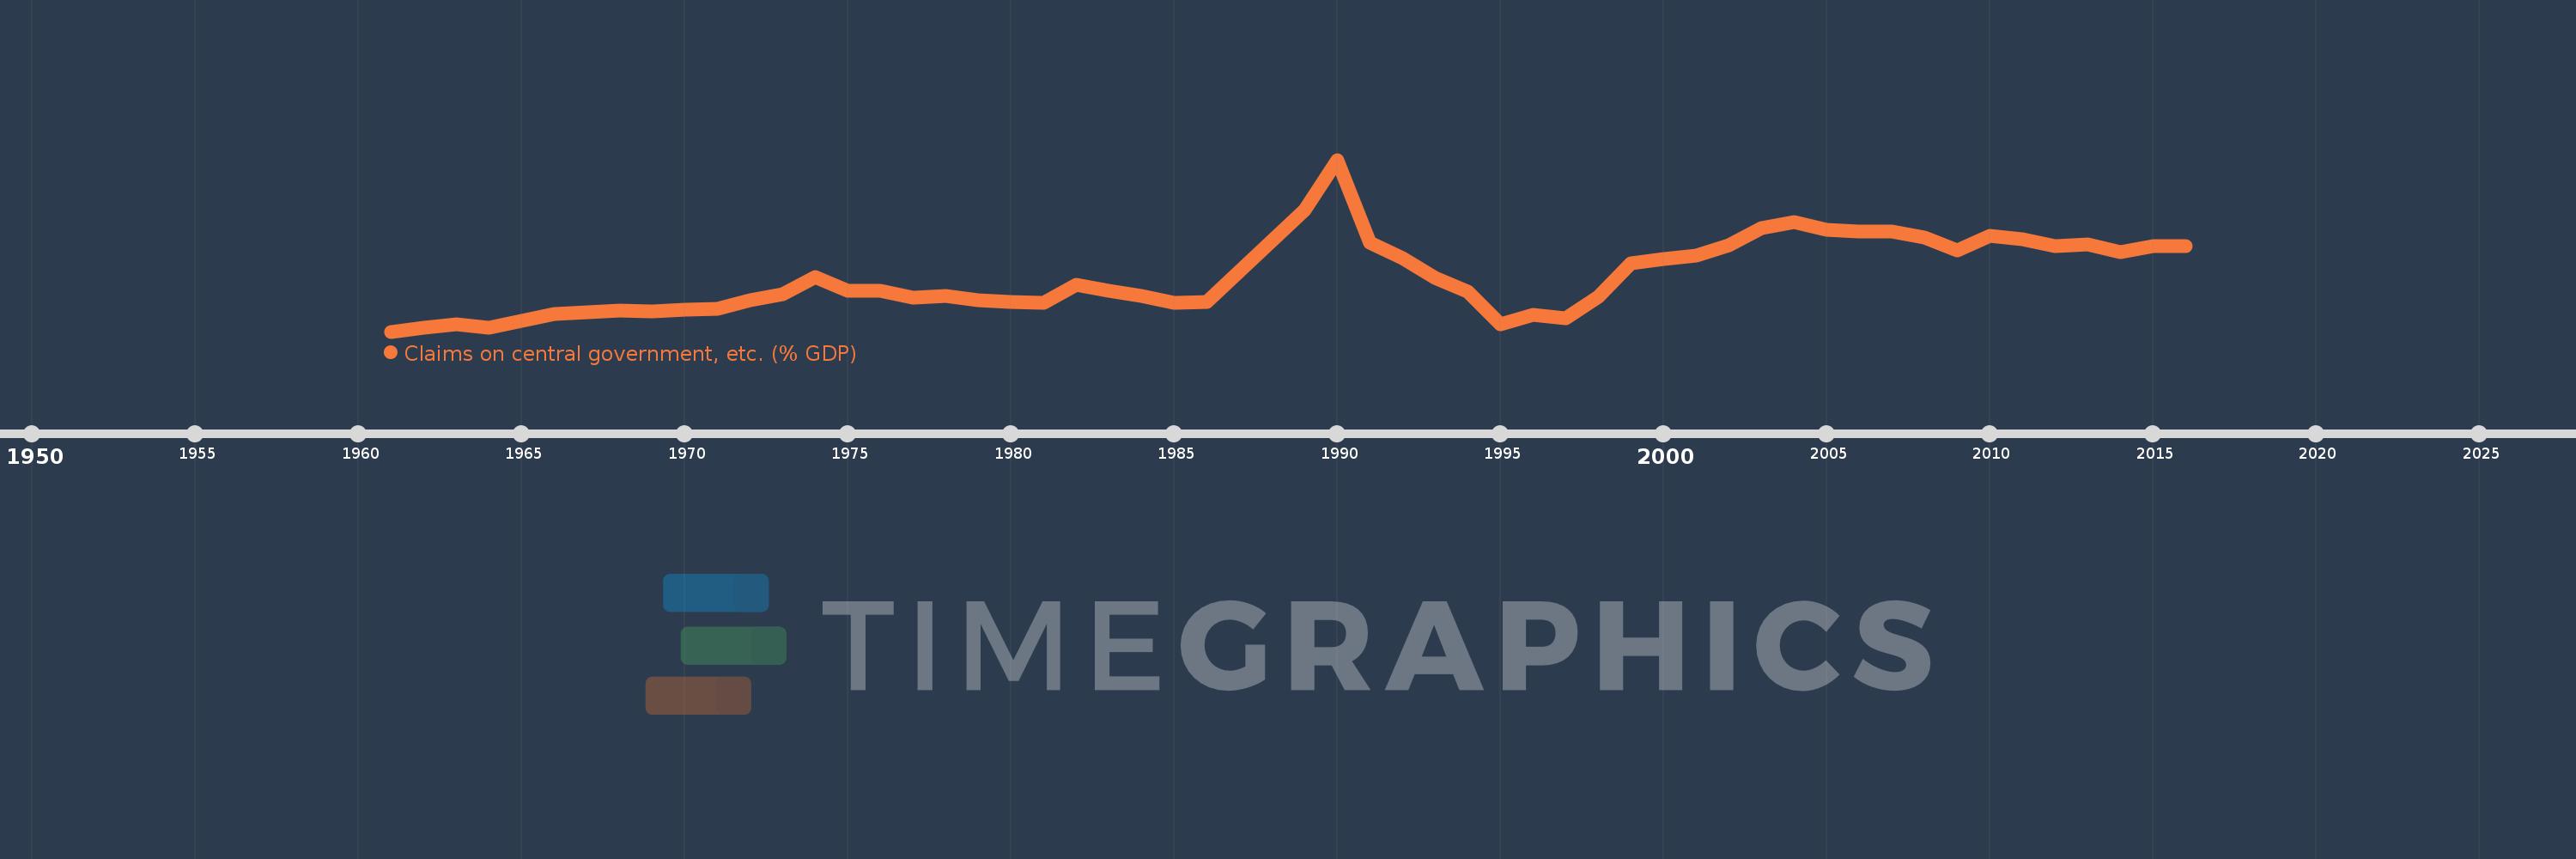
Claims on central government, etc. (% GDP)
2016,2015,2014,2013,2012,2011,2010,2009,2008,2007,2006,2005,2004,2003,2002,2001,2000,1999,1998,1997,1996,1995,1994,1993,1992,1991,1990,1989,1986,1985,1984,1983,1982,1981,1980,1979,1978,1977,1976,1975,1974,1973,1972,1971,1970,1969,1968,1967,1966,1965,1964,1963,1962,1961
Cette statistique dans les autres pays:
AfghanistanAlbaniaAlgeriaAngolaAntigua and BarbudaArab WorldArgentinaArmeniaArubaAustraliaAustriaAzerbaijanBahamas, TheBahrainBangladeshBarbadosBelarusBelgiumBelizeBeninBhutanBoliviaBosnia and HerzegovinaBotswanaBrazilBrunei DarussalamBulgariaBurkina FasoBurundiCabo VerdeCambodiaCameroonCanadaCaribbean small statesCentral African RepublicCentral Europe and the BalticsChadChileChinaColombiaComorosCongo, Dem. Rep.Congo, Rep.Costa RicaCote d'IvoireCroatiaCyprusCzech RepublicDenmarkDjiboutiDominicaDominican RepublicEarly-demographic dividendEast Asia & PacificEast Asia & Pacific (excluding high income)East Asia & Pacific (IDA & IBRD countries)EcuadorEgypt, Arab Rep.El SalvadorEquatorial GuineaEritreaEstoniaEthiopiaEuro areaEurope & Central AsiaEurope & Central Asia (excluding high income)Europe & Central Asia (IDA & IBRD countries)European UnionFijiFinlandFragile and conflict affected situationsFranceGabonGambia, TheGeorgiaGermanyGhanaGreeceGrenadaGuatemalaGuineaGuinea-BissauGuyanaHaitiHeavily indebted poor countries (HIPC)High incomeHondurasHong Kong SAR, ChinaHungaryIBRD onlyIcelandIDA & IBRD totalIDA blendIDA onlyIDA totalIndiaIndonesiaIran, Islamic Rep.IraqIrelandIsraelItalyJamaicaJapanJordanKazakhstanKenyaKorea, Rep.KosovoKuwaitKyrgyz RepublicLao PDRLate-demographic dividendLatin America & Caribbean Latin America & Caribbean (excluding high income)Latin America & the Caribbean (IDA & IBRD countries)LatviaLeast developed countries: UN classificationLebanonLesothoLiberiaLibyaLithuaniaLow & middle incomeLow incomeLower middle incomeLuxembourgMacao SAR, ChinaMacedonia, FYRMadagascarMalawiMalaysiaMaldivesMaliMaltaMauritaniaMauritiusMexicoMicronesia, Fed. Sts.Middle East & North AfricaMiddle East & North Africa (excluding high income)Middle East & North Africa (IDA & IBRD countries)Middle incomeMoldovaMongoliaMontenegroMoroccoMozambiqueMyanmarNamibiaNepalNetherlandsNew ZealandNicaraguaNigerNigeriaNorth AmericaNorwayOECD membersOmanOther small statesPacific island small statesPakistanPanamaPapua New GuineaParaguayPeruPhilippinesPolandPortugalPost-demographic dividendPre-demographic dividendQatarRomaniaRussian FederationRwandaSamoaSao Tome and PrincipeSaudi ArabiaSenegalSerbiaSeychellesSierra LeoneSingaporeSlovak RepublicSloveniaSmall statesSolomon IslandsSouth AfricaSouth AsiaSouth Asia (IDA & IBRD)South SudanSpainSri LankaSt. Kitts and NevisSt. LuciaSt. Vincent and the GrenadinesSub-Saharan Africa Sub-Saharan Africa (excluding high income)Sub-Saharan Africa (IDA & IBRD countries)SudanSurinameSwazilandSwedenSwitzerlandSyrian Arab RepublicTajikistanTanzaniaThailandTimor-LesteTogoTongaTrinidad and TobagoTunisiaTurkeyUgandaUkraineUnited Arab EmiratesUnited KingdomUnited StatesUpper middle incomeUruguayVanuatuVenezuela, RBVietnamWest Bank and GazaWorldYemen, Rep.ZambiaZimbabwe La ligne de temps
Cette échelle de temps montre un graphique de 1961 année à 2016 année Latin America & Caribbean . Les données jusqu'à 1960 année ne sont pas présentés. Quantité d'observations actuelles selon dates: 54.
Source (désignation):
Les indicateurs du développement mondiale
Source (organisation):
International Monetary Fund, International Financial Statistics and data files, and World Bank and OECD GDP estimates.
Catégories:
Financial Sector
Dernière mise à jour
23 avr. 2017
Les indicateurs de changement de valeurs selon les années
Minimum:
2.131
1 janv. 1961
Maximum:
34.569
1 janv. 1990
Pour la date d''observation
Valeur
Changement absolu
Le changement par rapport à la valeur précédente
1 janv. 1961
2.131
+2.131
0.0%
1 janv. 1962
2.891
+0.76
35.66%
1 janv. 1963
3.502
+0.611
21.13%
1 janv. 1964
2.808
-0.695
-19.83%
1 janv. 1965
4.119
+1.312
46.72%
1 janv. 1966
5.398
+1.279
31.05%
1 janv. 1967
5.8
+0.402
7.45%
1 janv. 1968
6.056
+0.255
4.4%
1 janv. 1969
5.996
-0.06
-0.99%
1 janv. 1970
6.342
+0.346
5.78%
1 janv. 1971
6.466
+0.124
1.95%
1 janv. 1972
8.032
+1.566
24.22%
1 janv. 1973
9.154
+1.123
13.98%
1 janv. 1974
12.388
+3.234
35.33%
1 janv. 1975
9.811
-2.577
-20.8%
1 janv. 1976
9.884
+0.072
0.73%
1 janv. 1977
8.483
-1.401
-14.17%
1 janv. 1978
8.906
+0.423
4.99%
1 janv. 1979
8.092
-0.815
-9.15%
1 janv. 1980
7.687
-0.405
-5.01%
1 janv. 1981
7.501
-0.185
-2.41%
1 janv. 1982
10.897
+3.395
45.26%
1 janv. 1983
9.763
-1.133
-10.4%
1 janv. 1984
8.901
-0.862
-8.83%
1 janv. 1985
7.539
-1.362
-15.3%
1 janv. 1986
7.679
+0.14
1.85%
1 janv. 1989
25.081
+17.402
226.62%
1 janv. 1990
34.569
+9.488
37.83%
1 janv. 1991
18.9
-15.67
-45.33%
1 janv. 1992
16.05
-2.85
-15.08%
1 janv. 1993
12.309
-3.741
-23.31%
1 janv. 1994
9.75
-2.558
-20.79%
1 janv. 1995
3.574
-6.176
-63.34%
1 janv. 1996
5.339
+1.764
49.36%
1 janv. 1997
4.7
-0.639
-11.96%
1 janv. 1998
8.674
+3.974
84.56%
1 janv. 1999
15.03
+6.356
73.27%
1 janv. 2000
15.895
+0.865
5.75%
1 janv. 2001
16.523
+0.629
3.96%
1 janv. 2002
18.496
+1.973
11.94%
1 janv. 2003
21.676
+3.179
17.19%
1 janv. 2004
22.812
+1.137
5.24%
1 janv. 2005
21.368
-1.444
-6.33%
1 janv. 2006
21.04
-0.328
-1.54%
1 janv. 2007
20.987
-0.053
-0.25%
1 janv. 2008
19.866
-1.121
-5.34%
1 janv. 2009
17.52
-2.346
-11.81%
1 janv. 2010
20.271
+2.751
15.7%
1 janv. 2011
19.605
-0.667
-3.29%
1 janv. 2012
18.326
-1.278
-6.52%
1 janv. 2013
18.564
+0.238
1.3%
1 janv. 2014
17.161
-1.403
-7.56%
1 janv. 2015
18.242
+1.081
6.3%
1 janv. 2016
18.227
-0.015
-0.08%
Classement des pays selon les statistiques actuelles par années


Commentaires: