29
/fr/
fr
AIzaSyAYiBZKx7MnpbEhh9jyipgxe19OcubqV5w
April 1, 2024
123233
Ecuador
ECU
true
2
1
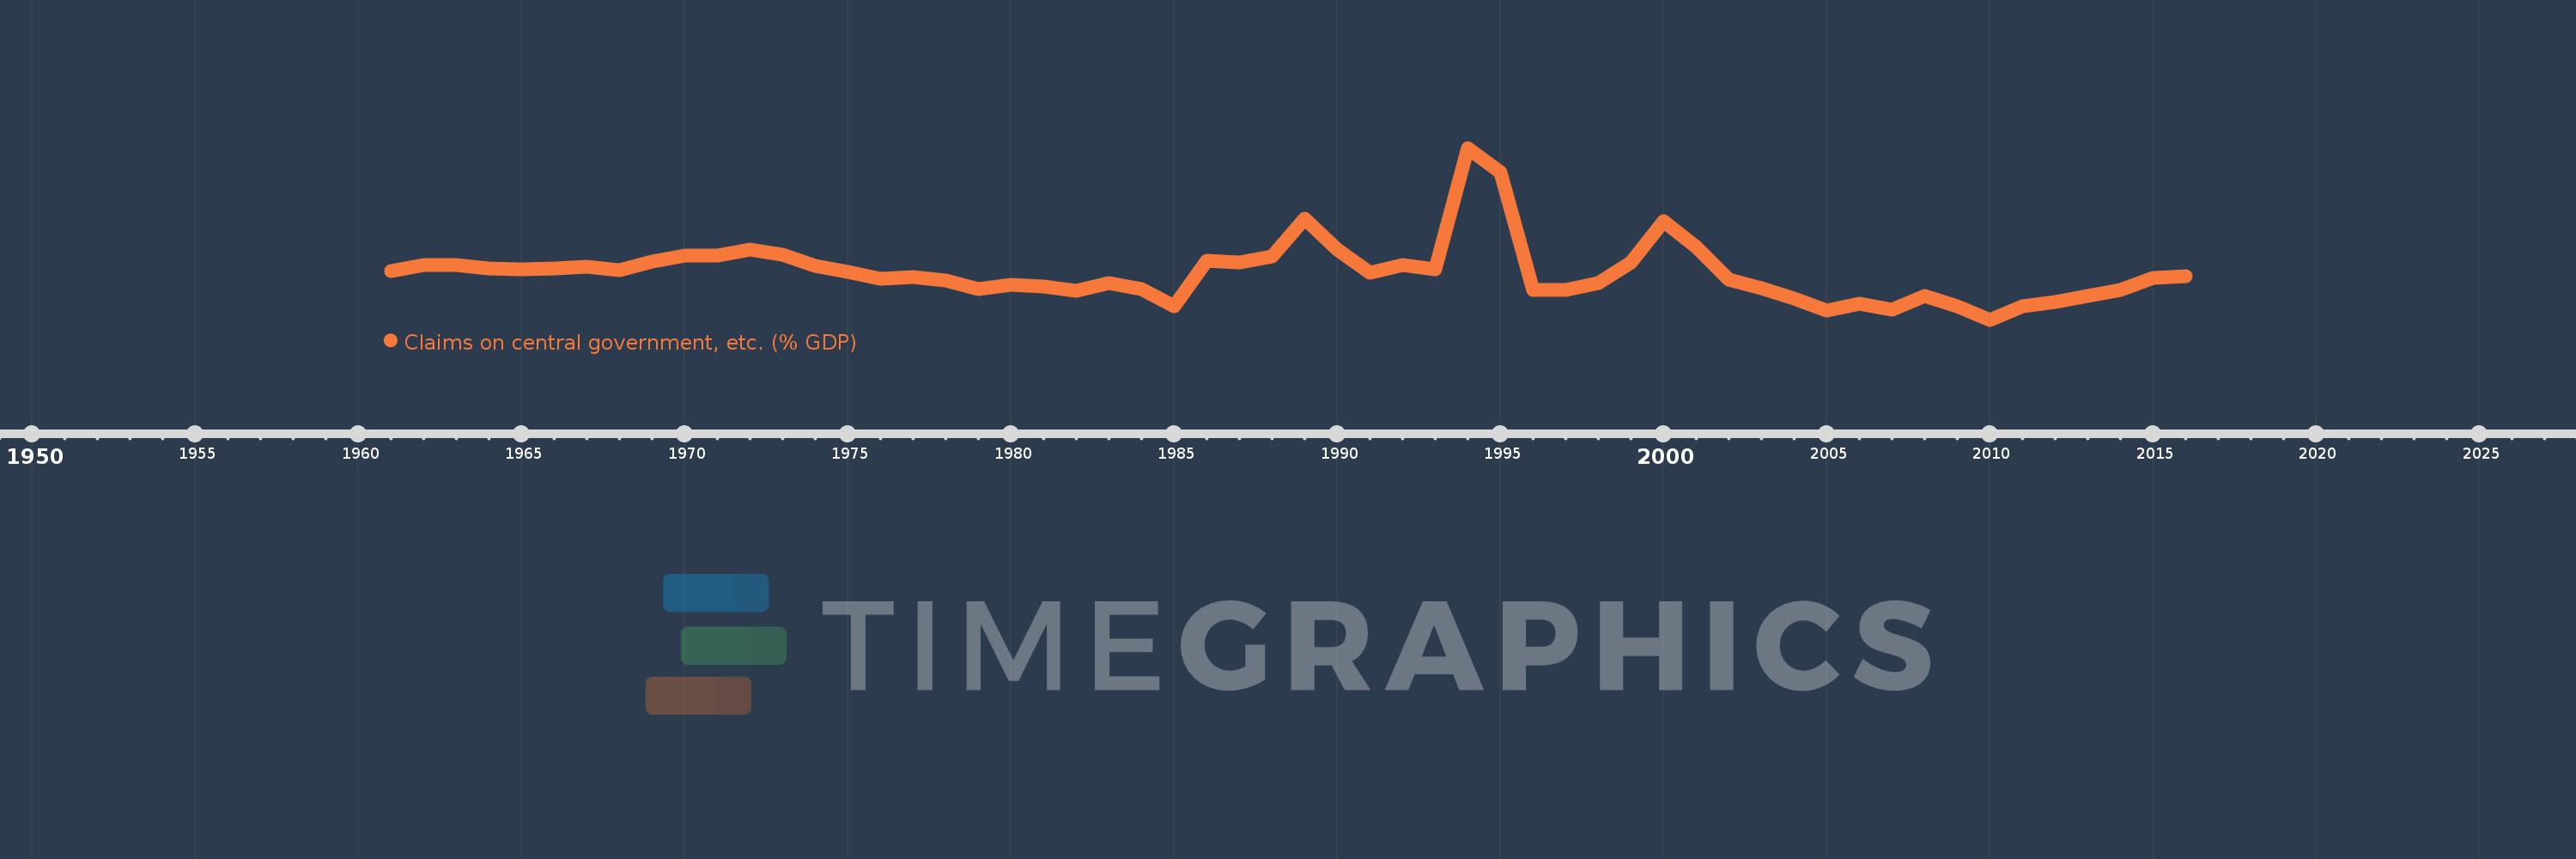
Claims on central government, etc. (% GDP)
2016,2015,2014,2013,2012,2011,2010,2009,2008,2007,2006,2005,2004,2003,2002,2001,2000,1999,1998,1997,1996,1995,1994,1993,1992,1991,1990,1989,1988,1987,1986,1985,1984,1983,1982,1981,1980,1979,1978,1977,1976,1975,1974,1973,1972,1971,1970,1969,1968,1967,1966,1965,1964,1963,1962,1961
Cette statistique dans les autres pays:
AfghanistanAlbaniaAlgeriaAngolaAntigua and BarbudaArab WorldArgentinaArmeniaArubaAustraliaAustriaAzerbaijanBahamas, TheBahrainBangladeshBarbadosBelarusBelgiumBelizeBeninBhutanBoliviaBosnia and HerzegovinaBotswanaBrazilBrunei DarussalamBulgariaBurkina FasoBurundiCabo VerdeCambodiaCameroonCanadaCaribbean small statesCentral African RepublicCentral Europe and the BalticsChadChileChinaColombiaComorosCongo, Dem. Rep.Congo, Rep.Costa RicaCote d'IvoireCroatiaCyprusCzech RepublicDenmarkDjiboutiDominicaDominican RepublicEarly-demographic dividendEast Asia & PacificEast Asia & Pacific (excluding high income)East Asia & Pacific (IDA & IBRD countries)EcuadorEgypt, Arab Rep.El SalvadorEquatorial GuineaEritreaEstoniaEthiopiaEuro areaEurope & Central AsiaEurope & Central Asia (excluding high income)Europe & Central Asia (IDA & IBRD countries)European UnionFijiFinlandFragile and conflict affected situationsFranceGabonGambia, TheGeorgiaGermanyGhanaGreeceGrenadaGuatemalaGuineaGuinea-BissauGuyanaHaitiHeavily indebted poor countries (HIPC)High incomeHondurasHong Kong SAR, ChinaHungaryIBRD onlyIcelandIDA & IBRD totalIDA blendIDA onlyIDA totalIndiaIndonesiaIran, Islamic Rep.IraqIrelandIsraelItalyJamaicaJapanJordanKazakhstanKenyaKorea, Rep.KosovoKuwaitKyrgyz RepublicLao PDRLate-demographic dividendLatin America & Caribbean Latin America & Caribbean (excluding high income)Latin America & the Caribbean (IDA & IBRD countries)LatviaLeast developed countries: UN classificationLebanonLesothoLiberiaLibyaLithuaniaLow & middle incomeLow incomeLower middle incomeLuxembourgMacao SAR, ChinaMacedonia, FYRMadagascarMalawiMalaysiaMaldivesMaliMaltaMauritaniaMauritiusMexicoMicronesia, Fed. Sts.Middle East & North AfricaMiddle East & North Africa (excluding high income)Middle East & North Africa (IDA & IBRD countries)Middle incomeMoldovaMongoliaMontenegroMoroccoMozambiqueMyanmarNamibiaNepalNetherlandsNew ZealandNicaraguaNigerNigeriaNorth AmericaNorwayOECD membersOmanOther small statesPacific island small statesPakistanPanamaPapua New GuineaParaguayPeruPhilippinesPolandPortugalPost-demographic dividendPre-demographic dividendQatarRomaniaRussian FederationRwandaSamoaSao Tome and PrincipeSaudi ArabiaSenegalSerbiaSeychellesSierra LeoneSingaporeSlovak RepublicSloveniaSmall statesSolomon IslandsSouth AfricaSouth AsiaSouth Asia (IDA & IBRD)South SudanSpainSri LankaSt. Kitts and NevisSt. LuciaSt. Vincent and the GrenadinesSub-Saharan Africa Sub-Saharan Africa (excluding high income)Sub-Saharan Africa (IDA & IBRD countries)SudanSurinameSwazilandSwedenSwitzerlandSyrian Arab RepublicTajikistanTanzaniaThailandTimor-LesteTogoTongaTrinidad and TobagoTunisiaTurkeyUgandaUkraineUnited Arab EmiratesUnited KingdomUnited StatesUpper middle incomeUruguayVanuatuVenezuela, RBVietnamWest Bank and GazaWorldYemen, Rep.ZambiaZimbabwe La ligne de temps
Cette échelle de temps montre un graphique de 1961 année à 2016 année Ecuador. Les données jusqu'à 1960 année ne sont pas présentés. Quantité d'observations actuelles selon dates: 56.
Source (désignation):
Les indicateurs du développement mondiale
Source (organisation):
International Monetary Fund, International Financial Statistics and data files, and World Bank and OECD GDP estimates.
Catégories:
Financial Sector
Dernière mise à jour
23 avr. 2017
Les indicateurs de changement de valeurs selon les années
Minimum:
-5.245
1 janv. 2010
Maximum:
17.597
1 janv. 1994
Pour la date d''observation
Valeur
Changement absolu
Le changement par rapport à la valeur précédente
1 janv. 1961
1.188
+1.188
0.0%
1 janv. 1962
2.081
+0.893
75.11%
1 janv. 1963
2.012
-0.069
-3.31%
1 janv. 1964
1.542
-0.47
-23.38%
1 janv. 1965
1.409
-0.133
-8.63%
1 janv. 1966
1.522
+0.114
8.06%
1 janv. 1967
1.765
+0.242
15.93%
1 janv. 1968
1.295
-0.469
-26.58%
1 janv. 1969
2.532
+1.236
95.42%
1 janv. 1970
3.256
+0.724
28.6%
1 janv. 1971
3.29
+0.034
1.05%
1 janv. 1972
4.06
+0.77
23.41%
1 janv. 1973
3.427
-0.633
-15.58%
1 janv. 1974
1.911
-1.517
-44.25%
1 janv. 1975
1.157
-0.753
-39.42%
1 janv. 1976
0.188
-0.969
-83.75%
1 janv. 1977
0.408
+0.22
117.1%
1 janv. 1978
-0.04
-0.449
-109.91%
1 janv. 1979
-1.223
-1.183
2.92 milles%
1 janv. 1980
-0.598
+0.625
-51.14%
1 janv. 1981
-0.839
-0.241
40.41%
1 janv. 1982
-1.434
-0.595
70.94%
1 janv. 1983
-0.409
+1.026
-71.5%
1 janv. 1984
-1.196
-0.788
192.69%
1 janv. 1985
-3.484
-2.288
191.2%
1 janv. 1986
2.612
+6.096
-174.96%
1 janv. 1987
2.394
-0.217
-8.33%
1 janv. 1988
3.218
+0.824
34.42%
1 janv. 1989
8.224
+5.005
155.52%
1 janv. 1990
4.076
-4.147
-50.43%
1 janv. 1991
1.043
-3.034
-74.42%
1 janv. 1992
2.021
+0.978
93.81%
1 janv. 1993
1.49
-0.531
-26.27%
1 janv. 1994
17.597
+16.107
1.08 milles%
1 janv. 1995
14.405
-3.192
-18.14%
1 janv. 1996
-1.281
-15.685
-108.89%
1 janv. 1997
-1.254
+0.027
-2.11%
1 janv. 1998
-0.321
+0.933
-74.42%
1 janv. 1999
2.408
+2.729
-850.94%
1 janv. 2000
7.805
+5.397
224.14%
1 janv. 2001
4.408
-3.397
-43.52%
1 janv. 2002
0.089
-4.32
-97.99%
1 janv. 2003
-1.091
-1.18
-1.33 milles%
1 janv. 2004
-2.382
-1.291
118.35%
1 janv. 2005
-3.983
-1.601
67.19%
1 janv. 2006
-3.08
+0.903
-22.67%
1 janv. 2007
-3.854
-0.774
25.13%
1 janv. 2008
-2.051
+1.803
-46.77%
1 janv. 2009
-3.41
-1.359
66.24%
1 janv. 2010
-5.245
-1.834
53.79%
1 janv. 2011
-3.423
+1.821
-34.73%
1 janv. 2012
-2.861
+0.562
-16.43%
1 janv. 2013
-2.073
+0.787
-27.52%
1 janv. 2014
-1.306
+0.768
-37.02%
1 janv. 2015
0.261
+1.567
-120.0%
1 janv. 2016
0.553
+0.292
111.64%
Classement des pays selon les statistiques actuelles par années


Commentaires: