29
/fr/
fr
AIzaSyAYiBZKx7MnpbEhh9jyipgxe19OcubqV5w
April 1, 2024
33188
European Union
EUU
false
2
1
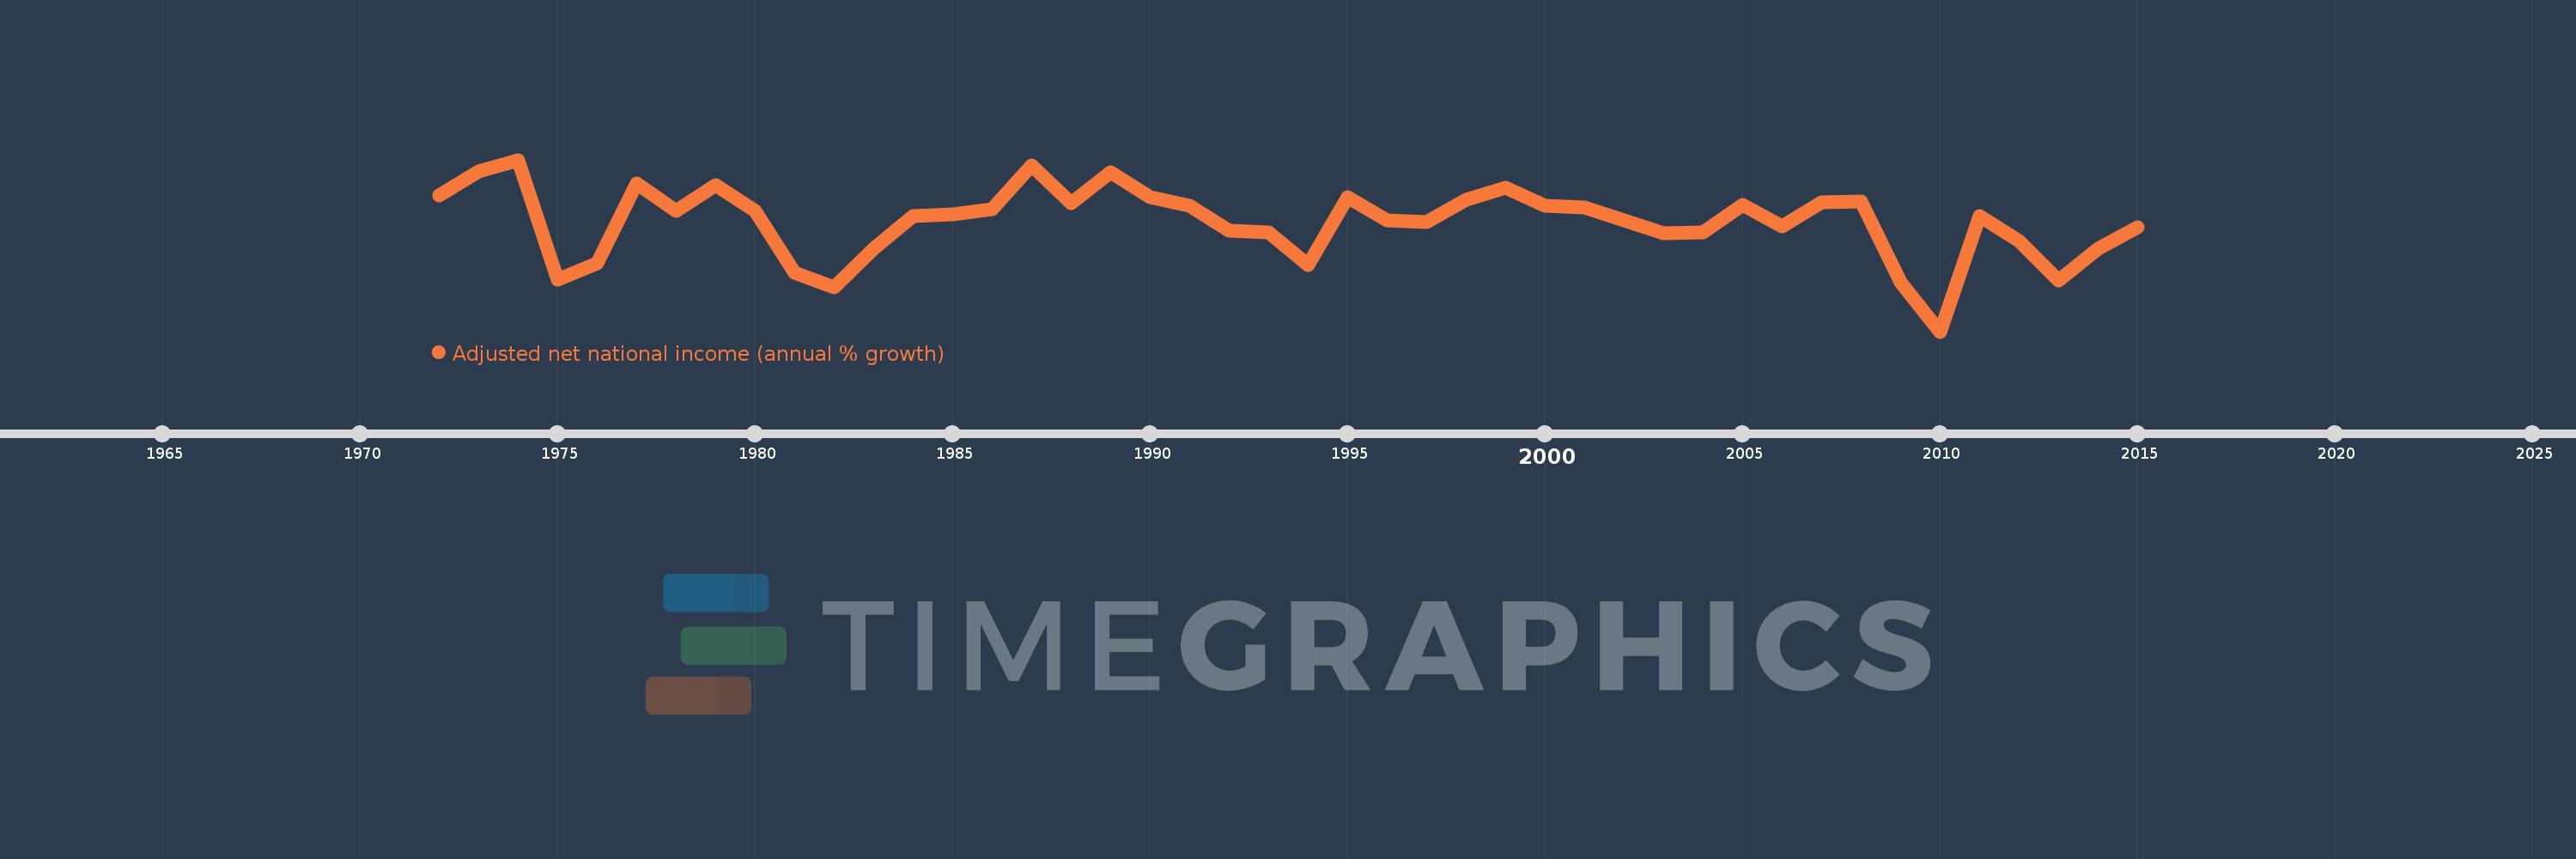
Adjusted net national income (annual % growth)
2015,2014,2013,2012,2011,2010,2009,2008,2007,2006,2005,2004,2003,2002,2001,2000,1999,1998,1997,1996,1995,1994,1993,1992,1991,1990,1989,1988,1987,1986,1985,1984,1983,1982,1981,1980,1979,1978,1977,1976,1975,1974,1973,1972
Cette statistique dans les autres pays:
La ligne de temps
Cette échelle de temps montre un graphique de 1972 année à 2015 année European Union. Les données jusqu'à 1971 année ne sont pas présentés. Quantité d'observations actuelles selon dates: 44.
Source (désignation):
Les indicateurs du développement mondiale
Source (organisation):
World Bank staff estimates based on sources and methods in World Bank's "The Changing Wealth of Nations: Measuring Sustainable Development in the New Millennium" (2011).
Catégories:
Economy & Growth
Dernière mise à jour
23 avr. 2017
Les indicateurs de changement de valeurs selon les années
Minimum:
-3.658
1 janv. 2010
Maximum:
5.305
1 janv. 1974
Pour la date d''observation
Valeur
Changement absolu
Le changement par rapport à la valeur précédente
1 janv. 1972
3.464
+3.464
0.0%
1 janv. 1973
4.686
+1.222
35.28%
1 janv. 1974
5.305
+0.62
13.23%
1 janv. 1975
-0.964
-6.27
-118.18%
1 janv. 1976
-0.109
+0.856
-88.71%
1 janv. 1977
4.086
+4.195
-3.85 milles%
1 janv. 1978
2.632
-1.455
-35.6%
1 janv. 1979
3.991
+1.359
51.63%
1 janv. 1980
2.619
-1.371
-34.36%
1 janv. 1981
-0.568
-3.187
-121.68%
1 janv. 1982
-1.351
-0.783
137.84%
1 janv. 1983
0.671
+2.021
-149.67%
1 janv. 1984
2.391
+1.72
256.48%
1 janv. 1985
2.457
+0.066
2.75%
1 janv. 1986
2.731
+0.275
11.17%
1 janv. 1987
5.033
+2.301
84.25%
1 janv. 1988
3.063
-1.969
-39.13%
1 janv. 1989
4.658
+1.594
52.04%
1 janv. 1990
3.359
-1.299
-27.88%
1 janv. 1991
2.928
-0.431
-12.82%
1 janv. 1992
1.617
-1.311
-44.78%
1 janv. 1993
1.538
-0.079
-4.89%
1 janv. 1994
-0.198
-1.736
-112.9%
1 janv. 1995
3.354
+3.553
-1.79 milles%
1 janv. 1996
2.158
-1.196
-35.66%
1 janv. 1997
2.051
-0.108
-4.99%
1 janv. 1998
3.233
+1.182
57.63%
1 janv. 1999
3.844
+0.611
18.9%
1 janv. 2000
2.924
-0.919
-23.92%
1 janv. 2001
2.83
-0.094
-3.23%
1 janv. 2002
2.149
-0.681
-24.07%
1 janv. 2003
1.481
-0.668
-31.1%
1 janv. 2004
1.522
+0.042
2.83%
1 janv. 2005
2.958
+1.436
94.29%
1 janv. 2006
1.817
-1.141
-38.57%
1 janv. 2007
3.069
+1.252
68.89%
1 janv. 2008
3.113
+0.044
1.44%
1 janv. 2009
-1.086
-4.199
-134.89%
1 janv. 2010
-3.658
-2.572
236.8%
1 janv. 2011
2.383
+6.041
-165.14%
1 janv. 2012
1.073
-1.31
-54.96%
1 janv. 2013
-1.005
-2.078
-193.62%
1 janv. 2014
0.67
+1.675
-166.68%
1 janv. 2015
1.785
+1.115
166.36%
Classement des pays selon les statistiques actuelles par années


Commentaires: