29
/fr/
fr
AIzaSyAYiBZKx7MnpbEhh9jyipgxe19OcubqV5w
April 1, 2024
104499
Chile
CHL
true
2
1
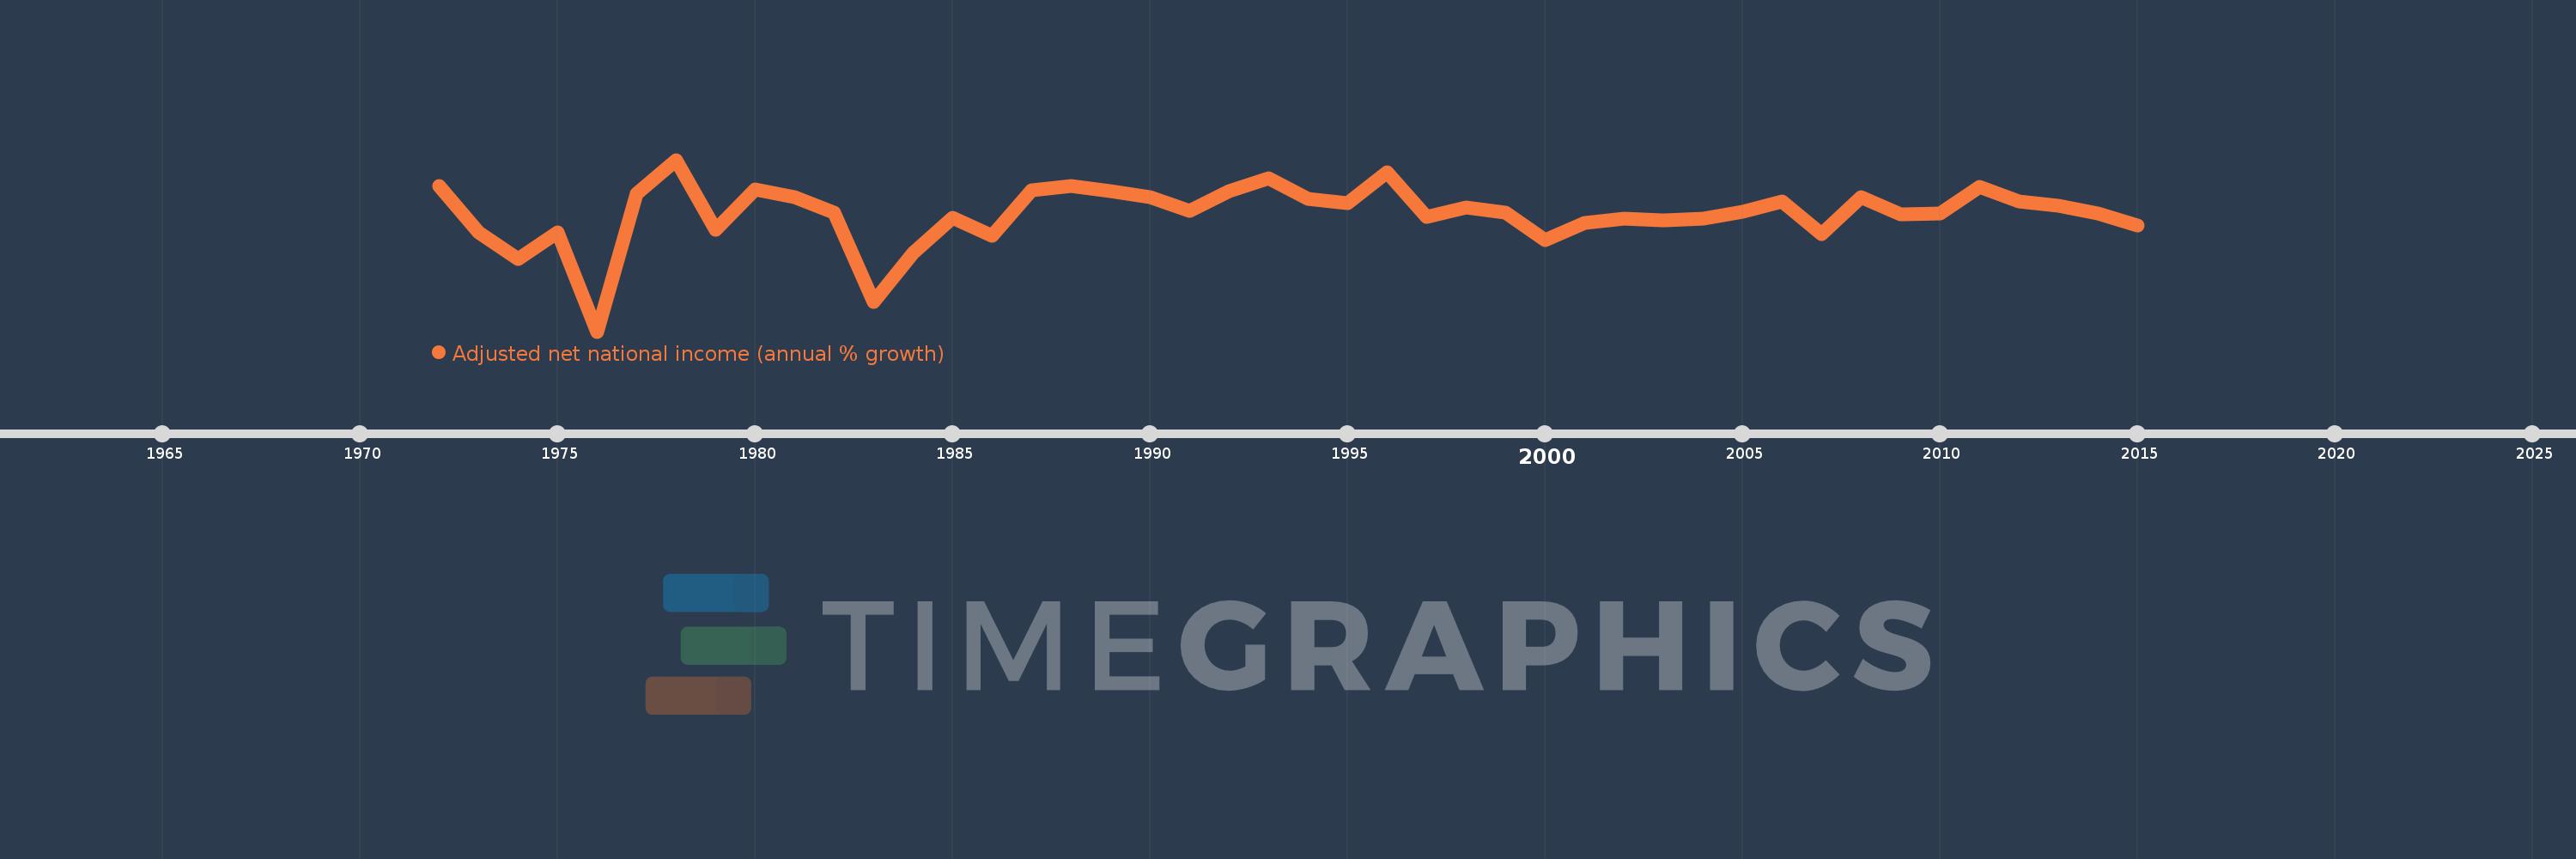
Adjusted net national income (annual % growth)
2015,2014,2013,2012,2011,2010,2009,2008,2007,2006,2005,2004,2003,2002,2001,2000,1999,1998,1997,1996,1995,1994,1993,1992,1991,1990,1989,1988,1987,1986,1985,1984,1983,1982,1981,1980,1979,1978,1977,1976,1975,1974,1973,1972
Cette statistique dans les autres pays:
La ligne de temps
Cette échelle de temps montre un graphique de 1972 année à 2015 année Chile. Les données jusqu'à 1971 année ne sont pas présentés. Quantité d'observations actuelles selon dates: 44.
Source (désignation):
Les indicateurs du développement mondiale
Source (organisation):
World Bank staff estimates based on sources and methods in World Bank's "The Changing Wealth of Nations: Measuring Sustainable Development in the New Millennium" (2011).
Catégories:
Economy & Growth
Dernière mise à jour
23 avr. 2017
Les indicateurs de changement de valeurs selon les années
Minimum:
-25.761
1 janv. 1976
Maximum:
18.191
1 janv. 1978
Pour la date d''observation
Valeur
Changement absolu
Le changement par rapport à la valeur précédente
1 janv. 1972
11.568
+11.568
0.0%
1 janv. 1973
-0.333
-11.901
-102.88%
1 janv. 1974
-7.107
-6.773
2.03 milles%
1 janv. 1975
-0.323
+6.784
-95.46%
1 janv. 1976
-25.761
-25.438
7.88 milles%
1 janv. 1977
9.43
+35.191
-136.61%
1 janv. 1978
18.191
+8.761
92.91%
1 janv. 1979
0.382
-17.81
-97.9%
1 janv. 1980
10.675
+10.293
2.7 milles%
1 janv. 1981
8.553
-2.122
-19.88%
1 janv. 1982
4.741
-3.812
-44.57%
1 janv. 1983
-18.277
-23.018
-485.5%
1 janv. 1984
-5.646
+12.631
-69.11%
1 janv. 1985
3.385
+9.031
-159.95%
1 janv. 1986
-1.222
-4.607
-136.09%
1 janv. 1987
10.419
+11.641
-952.86%
1 janv. 1988
11.437
+1.018
9.77%
1 janv. 1989
10.263
-1.174
-10.26%
1 janv. 1990
8.536
-1.727
-16.83%
1 janv. 1991
5.132
-3.405
-39.88%
1 janv. 1992
10.158
+5.026
97.95%
1 janv. 1993
13.486
+3.328
32.76%
1 janv. 1994
8.148
-5.338
-39.58%
1 janv. 1995
7.179
-0.969
-11.9%
1 janv. 1996
14.915
+7.736
107.76%
1 janv. 1997
3.593
-11.322
-75.91%
1 janv. 1998
6.094
+2.5
69.59%
1 janv. 1999
4.599
-1.494
-24.52%
1 janv. 2000
-2.318
-6.917
-150.4%
1 janv. 2001
2.056
+4.374
-188.69%
1 janv. 2002
3.246
+1.19
57.88%
1 janv. 2003
2.795
-0.45
-13.88%
1 janv. 2004
3.086
+0.29
10.39%
1 janv. 2005
4.823
+1.737
56.31%
1 janv. 2006
7.631
+2.808
58.22%
1 janv. 2007
-0.788
-8.42
-110.33%
1 janv. 2008
8.523
+9.312
-1.18 milles%
1 janv. 2009
4.3
-4.224
-49.55%
1 janv. 2010
4.512
+0.212
4.93%
1 janv. 2011
11.183
+6.671
147.87%
1 janv. 2012
7.634
-3.549
-31.73%
1 janv. 2013
6.502
-1.132
-14.83%
1 janv. 2014
4.363
-2.139
-32.9%
1 janv. 2015
1.42
-2.944
-67.46%
Classement des pays selon les statistiques actuelles par années


Commentaires: