29
/fr/
fr
AIzaSyAYiBZKx7MnpbEhh9jyipgxe19OcubqV5w
April 1, 2024
30828
Europe & Central Asia
ECS
false
2
1
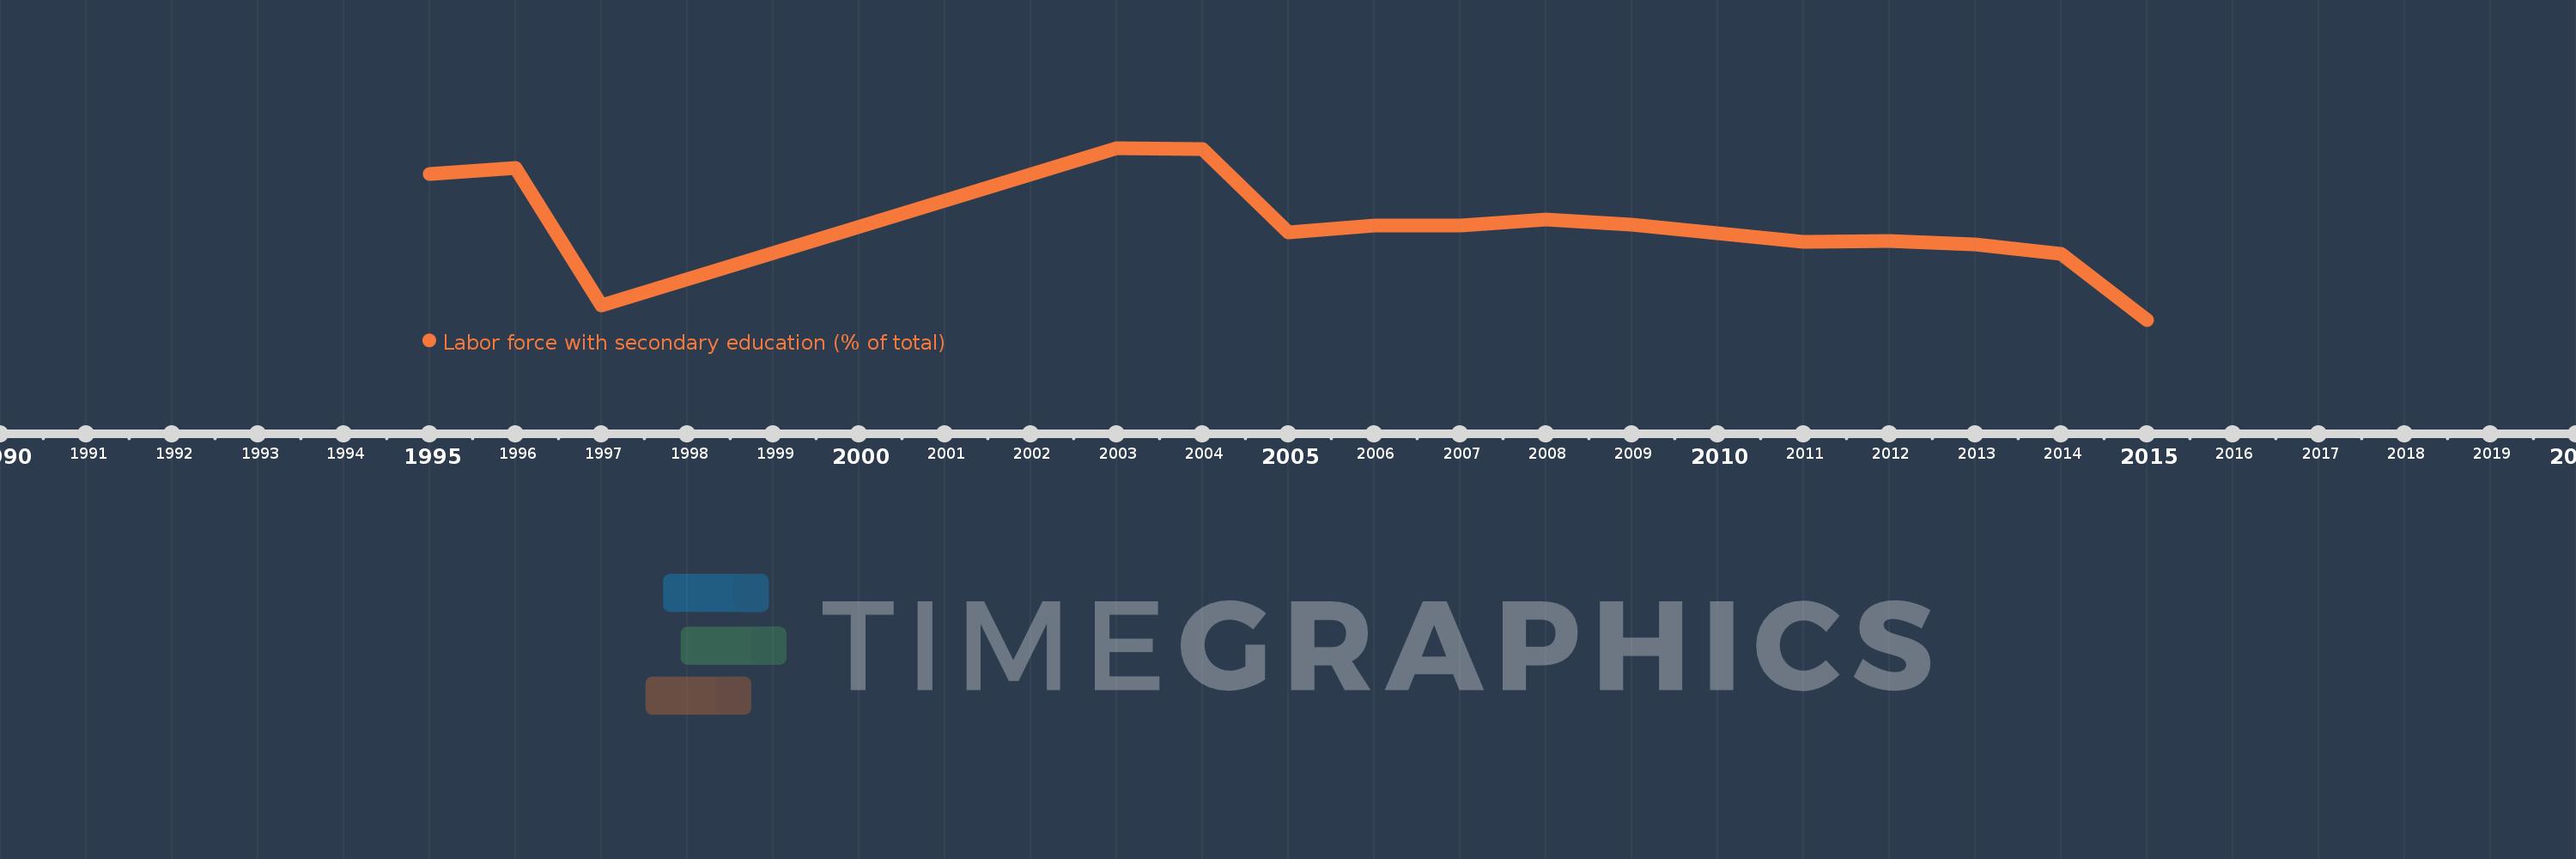
Labor force with secondary education (% of total)
2015,2014,2013,2012,2011,2010,2009,2008,2007,2006,2005,2004,2003,1997,1996,1995
Cette statistique dans les autres pays:
La ligne de temps
Cette échelle de temps montre un graphique de 1995 année à 2015 année Europe & Central Asia. Les données jusqu'à 1994 année ne sont pas présentés. Quantité d'observations actuelles selon dates: 16.
Source (désignation):
Les indicateurs du développement mondiale
Source (organisation):
International Labour Organization, Key Indicators of the Labour Market database.
Catégories:
Education, Social Protection & Labor
Dernière mise à jour
23 avr. 2017
Les indicateurs de changement de valeurs selon les années
Minimum:
42.016
1 janv. 2015
Maximum:
51.548
1 janv. 2003
Pour la date d''observation
Valeur
Changement absolu
Le changement par rapport à la valeur précédente
1 janv. 1995
50.107
+50.107
0.0%
1 janv. 1996
50.461
+0.354
0.71%
1 janv. 1997
42.797
-7.664
-15.19%
1 janv. 2003
51.548
+8.751
20.45%
1 janv. 2004
51.486
-0.062
-0.12%
1 janv. 2005
46.847
-4.64
-9.01%
1 janv. 2006
47.249
+0.402
0.86%
1 janv. 2007
47.248
-0.001
0.0%
1 janv. 2008
47.561
+0.313
0.66%
1 janv. 2009
47.305
-0.255
-0.54%
1 janv. 2010
46.823
-0.482
-1.02%
1 janv. 2011
46.344
-0.479
-1.02%
1 janv. 2012
46.383
+0.039
0.08%
1 janv. 2013
46.213
-0.169
-0.36%
1 janv. 2014
45.679
-0.535
-1.16%
1 janv. 2015
42.016
-3.663
-8.02%
Classement des pays selon les statistiques actuelles par années


Commentaires: