29
/fr/
fr
AIzaSyAYiBZKx7MnpbEhh9jyipgxe19OcubqV5w
April 1, 2024
283794
West Bank and Gaza
PSE
true
2
1
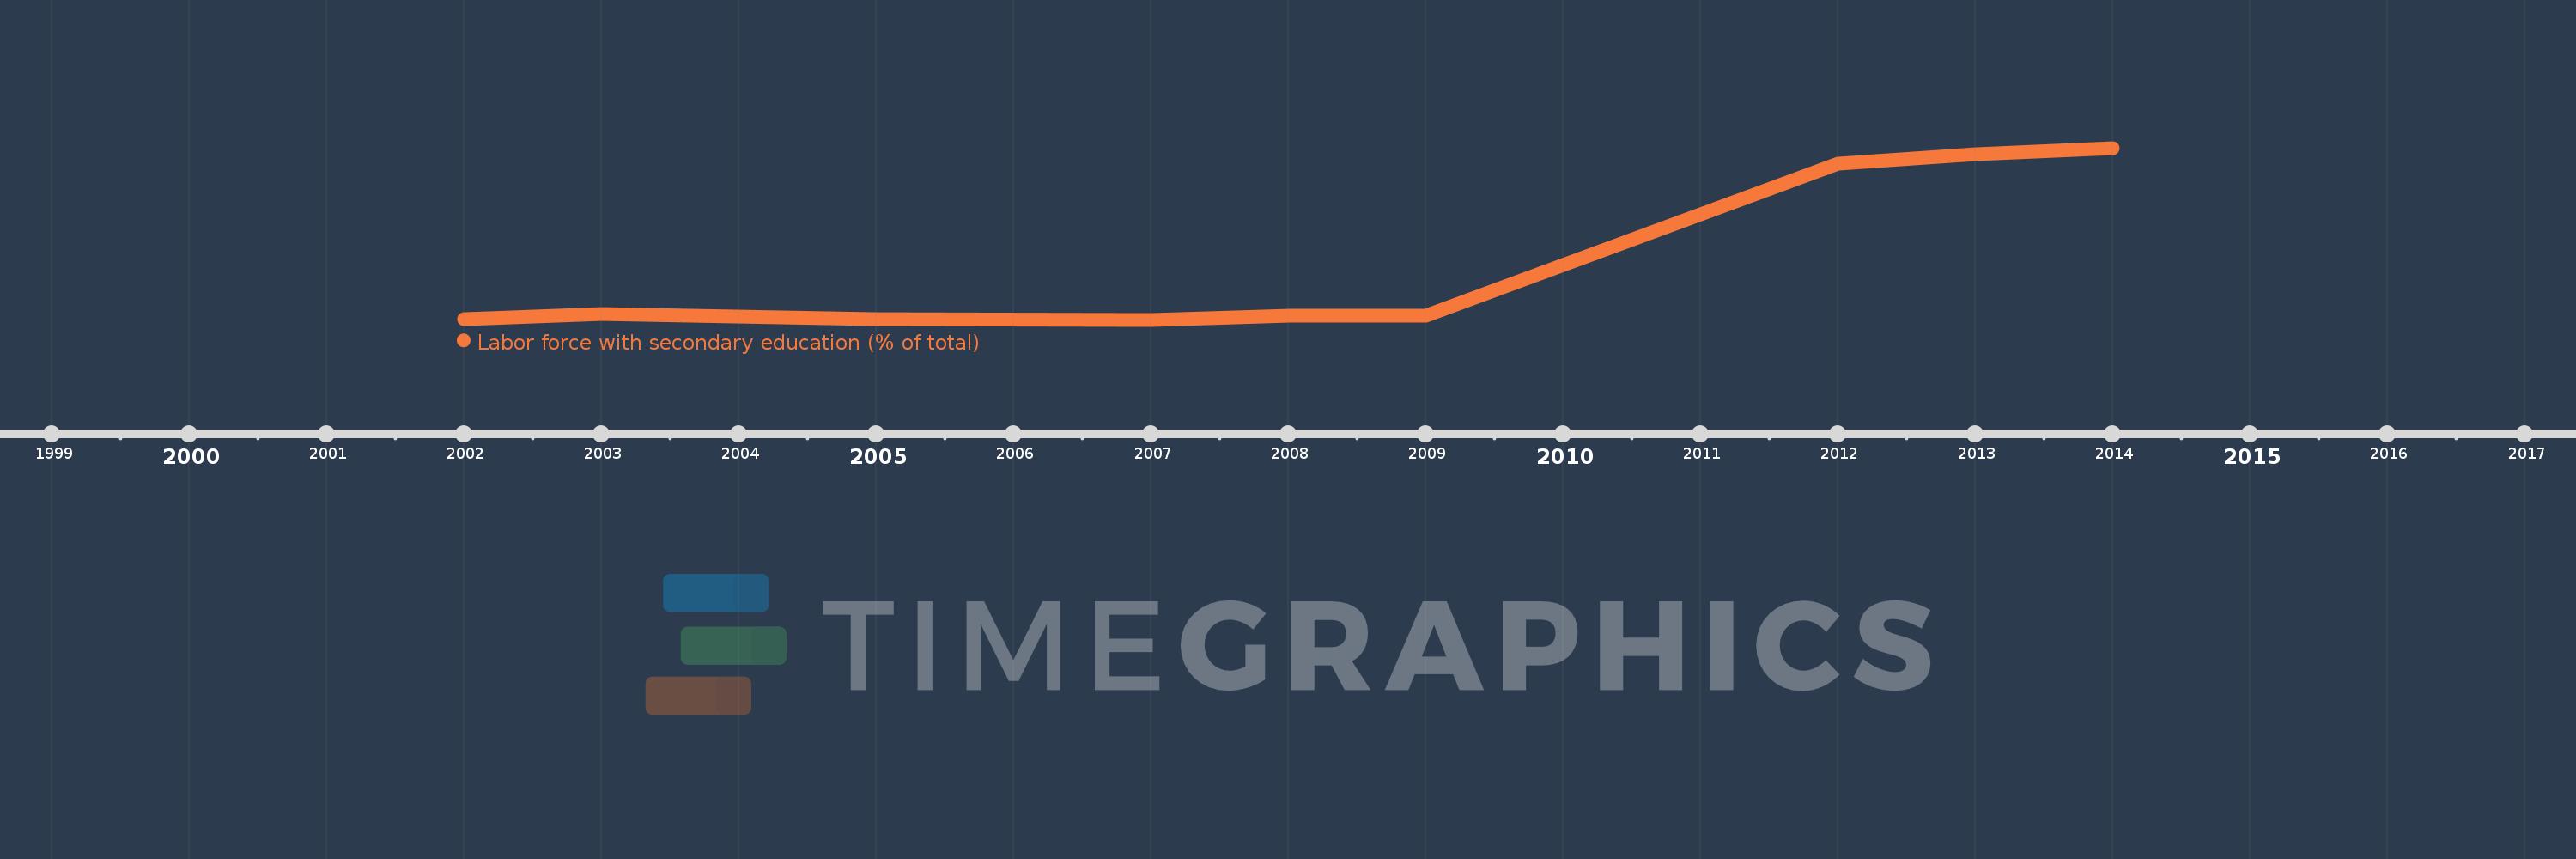
Labor force with secondary education (% of total)
2014,2013,2012,2009,2008,2007,2005,2003,2002
Cette statistique dans les autres pays:
La ligne de temps
Cette échelle de temps montre un graphique de 2002 année à 2014 année West Bank and Gaza. Les données jusqu'à 2001 année ne sont pas présentés. Quantité d'observations actuelles selon dates: 9.
Source (désignation):
Les indicateurs du développement mondiale
Source (organisation):
International Labour Organization, Key Indicators of the Labour Market database.
Catégories:
Education, Social Protection & Labor
Dernière mise à jour
23 avr. 2017
Les indicateurs de changement de valeurs selon les années
Pour la date d''observation
Valeur
Changement absolu
Le changement par rapport à la valeur précédente
1 janv. 2002
15.4
+15.4
0.0%
1 janv. 2003
16.1
+0.7
4.55%
1 janv. 2005
15.4
-0.7
-4.35%
1 janv. 2007
15.3
-0.1
-0.65%
1 janv. 2008
15.9
+0.6
3.92%
1 janv. 2009
15.8
-0.1
-0.63%
1 janv. 2012
36.5
+20.7
131.01%
1 janv. 2013
37.7
+1.2
3.29%
1 janv. 2014
38.6
+0.9
2.39%
Classement des pays selon les statistiques actuelles par années


Commentaires: